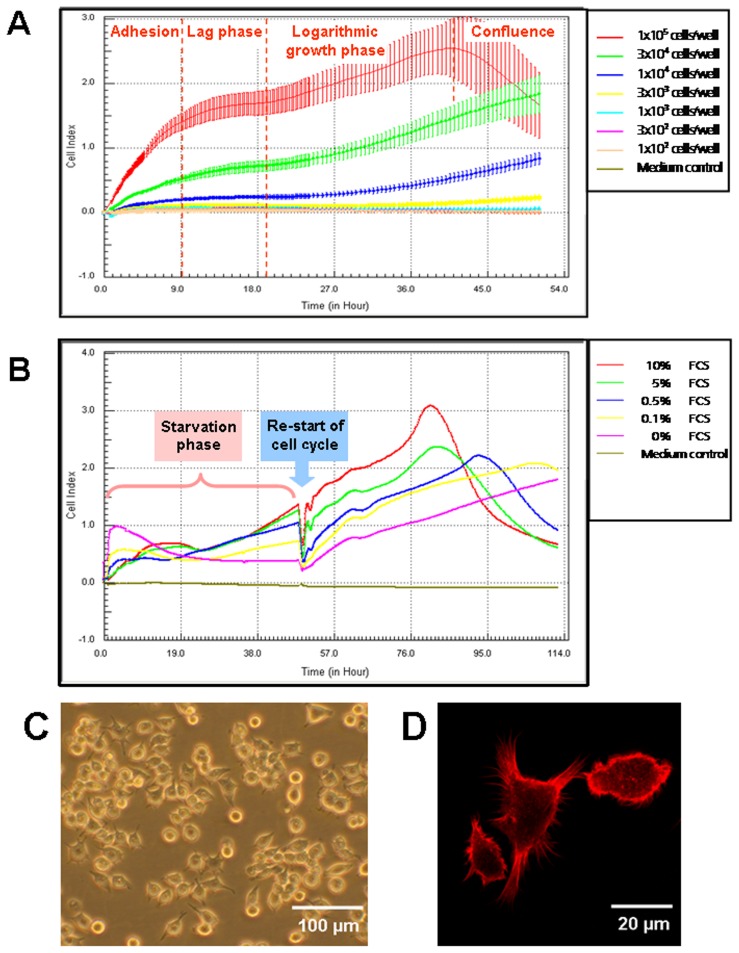
Figure 2. Optimum cell culture conditions and morphology of cultured MuMac-E8 cells.
By means of real-time cell analysis using the xCELLigence system the optimum cell density (n = 12 per value of cell density, mean ± SD; A) and the optimum serum supplementation for cell synchronization through serum deprivation (B) were determined. Typical morphology of MuMac-E8 cells in culture was shown by inverse phase contrast microscopy (Axiovert, Zeiss). The majority of the cells were found to grow adherent until confluence (C). Visualisation of cell spreading after fluorescence staining of F-actin with Phalloidin-Alexa was performed by confocal laser-scanning microscopy (LSM 510 Meta, Zeiss) (D). Figure was reprint from Biochemica, 4, 14–16 [12] with permission from the journal.

