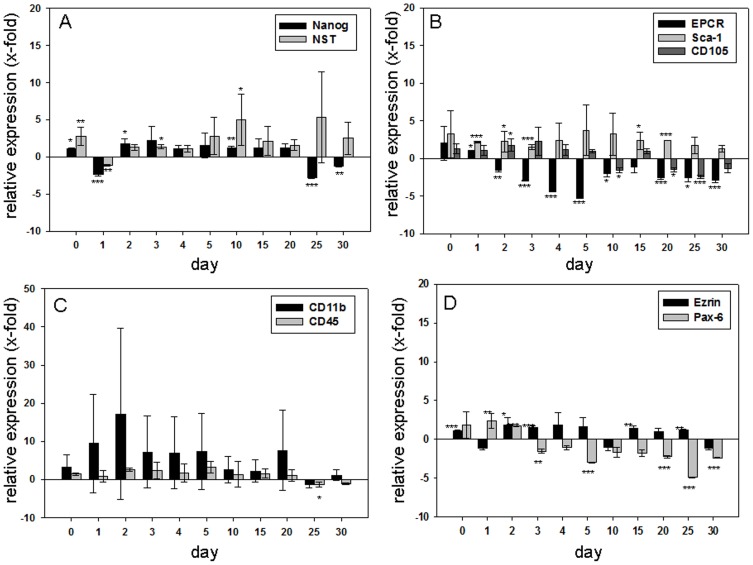
Figure 3. Relative mRNA expression of several pluripotency and differentiation markers.
(A) Relative expression of the marker of pluripotency Nanog and Nucleostemin (NST) determined by quantitative real-time RT-PCR (n = 6 per gene). Shown is the resultant of two independent experiments, mean ± SD. The expressions are shown in relation to control cells (prior to synchronization). Negative values stand for a reduced expression, positive values for an increased expression of each gene compared to control cells. Nanog was hardly regulated. There were only small increases or decreases in expression. Nucleostemin (NST) showed on day 10 and 25 a 4-fold increase in expression. On all other days of culture variations were found around the control value. (B) Relative expression of the hematopoietic markers EPCR, Sca-1 and the mesenchymal marker CD105 determined by quantitative real-time RT-PCR (n = 6 per gene). Shown is the resultant of two independent experiments, mean ± SD. The expressions are shown in relation to control cells (prior to synchronization). Negative values stand for a reduced expression, positive values for an increased expression of each gene compared to control cells. EPCR showed in the first days after synchronization a significant decrease in expression and approached back to the expression level of control cells. In Sca-1 a slightly increased expression was observed, while it approached to the control value 30 days after treatment. CD105 expression rate decreased slightly within 30 days. (C) Relative expression of the hematopoietic markers CD11b and CD45 determined by quantitative real-time RT-PCR (n = 6 per gene). Shown is the resultant of two independent experiments, mean ± SD. The expressions are shown in relation to control cells (prior to synchronization). Negative values stand for a reduced expression, positive values for an increased expression of each gene compared to control cells. CD11b expression showed a clear increase up to day 2. Until day 30 the expression levels of CD11b approached to the control value. For CD45, only minor fluctuations were determined around the control value. (D) Relative expression of the neuronal markers Ezrin and Pax-6 determined by quantitative real-time RT-PCR (n = 6 per gene). Shown is the resultant of two independent experiments, mean ± SD. The expressions are shown in relation to control cells (prior to synchronization). Negative values stand for a reduced expression, positive values for an increased expression of each gene compared to control cells. Ezrin showed very moderate expression increases and reductions, which followed no clear pattern. Pax-6 expression was found to be decreased up to 5-fold of the control level between days 3 and 30.

