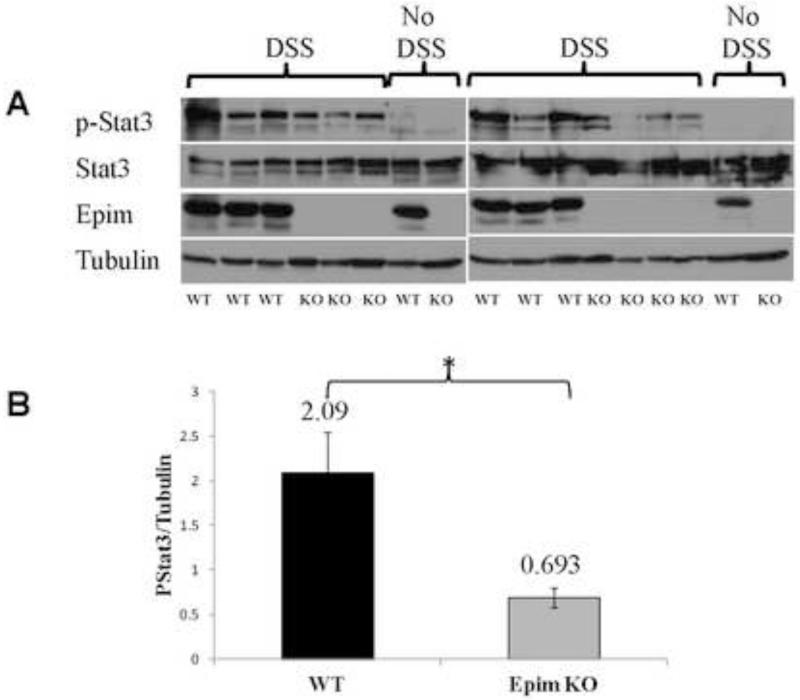
Figure 3. p-Stat3 expression is decreased in Epim−/− DSS treated colon.
p-Stat3 expression in Epim−/− descending colon was examined by immunoblot. Representative blots of two separate experiments are shown (A). p-Stat3 band intensity relative to that of the loading protein tubulin was measured. As expected, there is minimal to no p-Stat3 expression in untreated animals. All animals expressed un-phosphorylated Stat3. Only WT mice expressed Epim. The bottom row shows the loading protein tubulin. After treatment with DSS, there is a blunted increase in p-Stat3 expression in Epim−/− versus WT colon. (B) Quantification of band intensity confirms that p-Stat3 expression remained significantly less in the DSS treated Epim−/− (n=7) compared to WT (n=6) colon.

