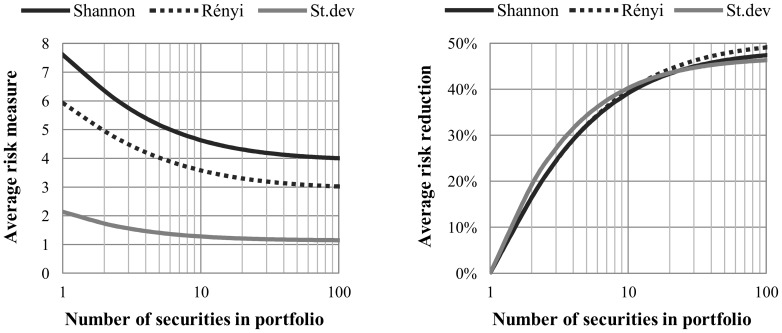
Figure 1. Average value of risk and risk reduction vs. number of securities in portfolio.
Note: We generate 10 million random equally weighted portfolios with different number of securities involved (at most 100,000 for each size) based on 150 randomly selected securities from S&P500. The risk of portfolios is estimated by standard deviation (gray continuous curve), Shannon- (black continuous curve) and Rényi entropy (black dashed curve) in the period from 1985 to the end of 2011. Both types of entropy functions are calculated by histogram based density function estimation. The left chart shows the average risk estimates for each portfolio size, and the right chart shows the risk reduction compared to an average risk of single security portfolio.

