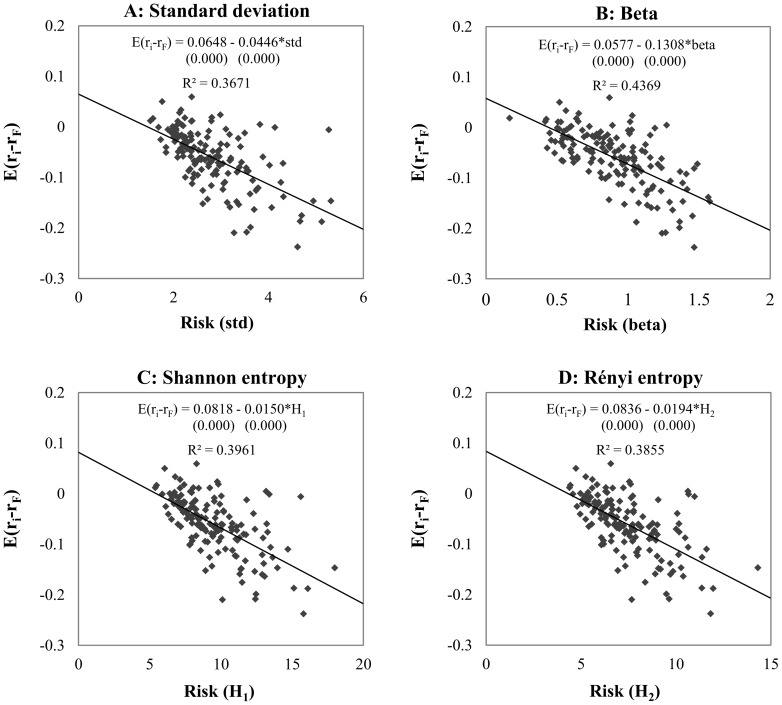
Figure 6. Explanatory power of risk measures in bearish sample.
Note: The panels show the relationship between the expected risk premium of securities and risk by using different estimation methods. We present the equation of linear regression and the goodness of fit (R 2).We estimated the risk of 150 random securities in downward trend periods (bear market) from 1985 to the end of 2011 using standard deviation, CAPM beta, Shannon- and Rényi entropy risk estimation methods. Both types of entropy functions are calculated by histogram based density function estimation, with 175 bins for Shannon entropy and 50 bins for Rényi entropy. Under the OLS regression equations in brackets the p-values can be seen for each parameter estimations. The R 2 of the models applying entropy based risk measures are significantly higher than the model with standard deviation at 1% level.

