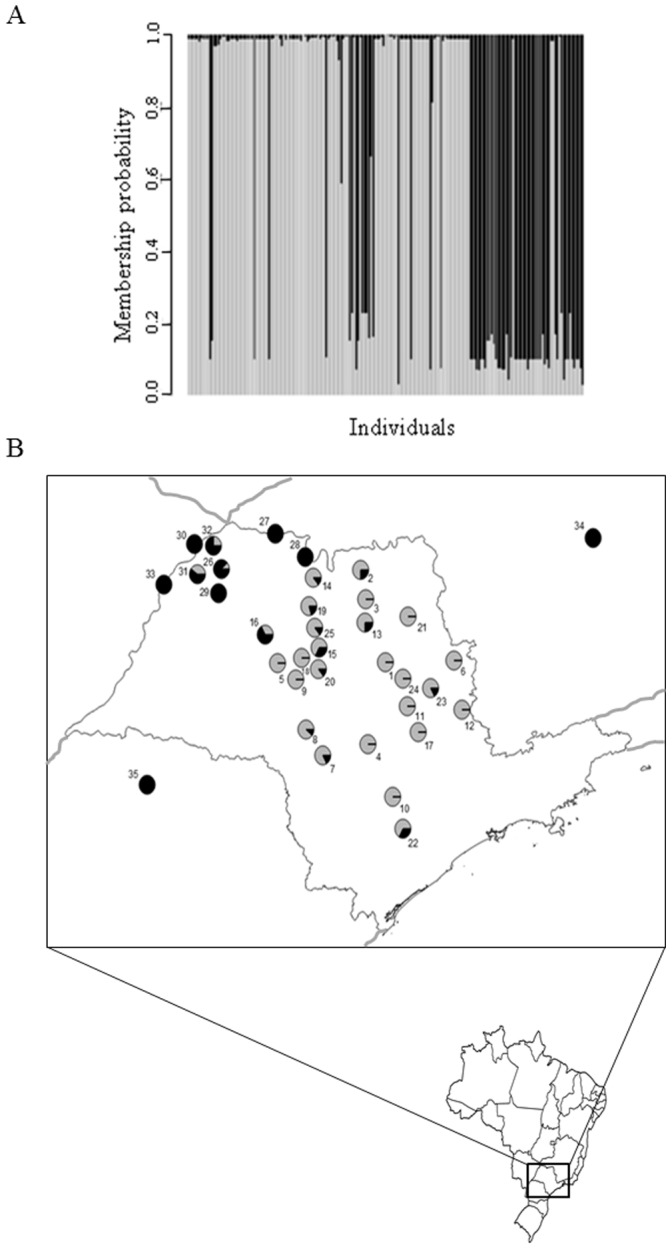
Figure 2.

a) Membership probability of each individual to belong to group I or II, b) Membership probability plot on a map of the state of São Paulo. Group I in grey and Group II in black. Numbers on the map refer to the different localities sampled as reported in Table 1.
