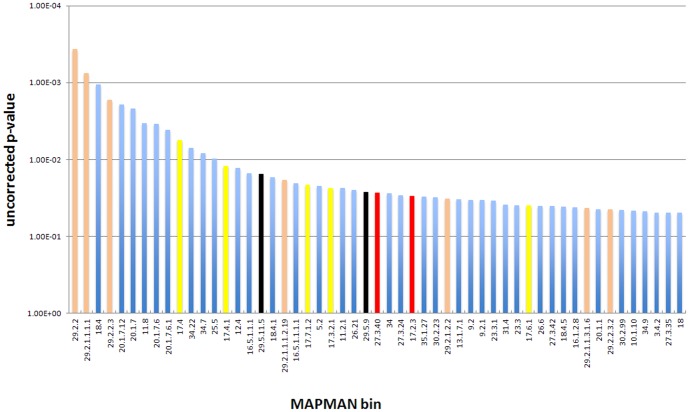
Figure 7. Results of an analysis of global gene expression in the roots of the wt and oxt6 mutant.
Gene expression was measured using the RNA-Seq functionality of CLC Genomics Workbench, and the results analyzed in MAPMAN as described in Methods. Bins representing functional groups of genes whose expression is significantly different in the wt and mutant were identified and the p-values that describe the conformance with the hypothesis that the two backgrounds are identical were plotted as shown; for this, the log(10) values for the reciprocal of each p-value was calculated and used in the graph. Bins mentioned in the text are color-coded and described beneath the plot. The full set of bins and p-values for this analysis is given in S2 Table.

