
Figure 6. Image of immunofluorescence, PCR electrophoresis and ELISA detection after transfection.
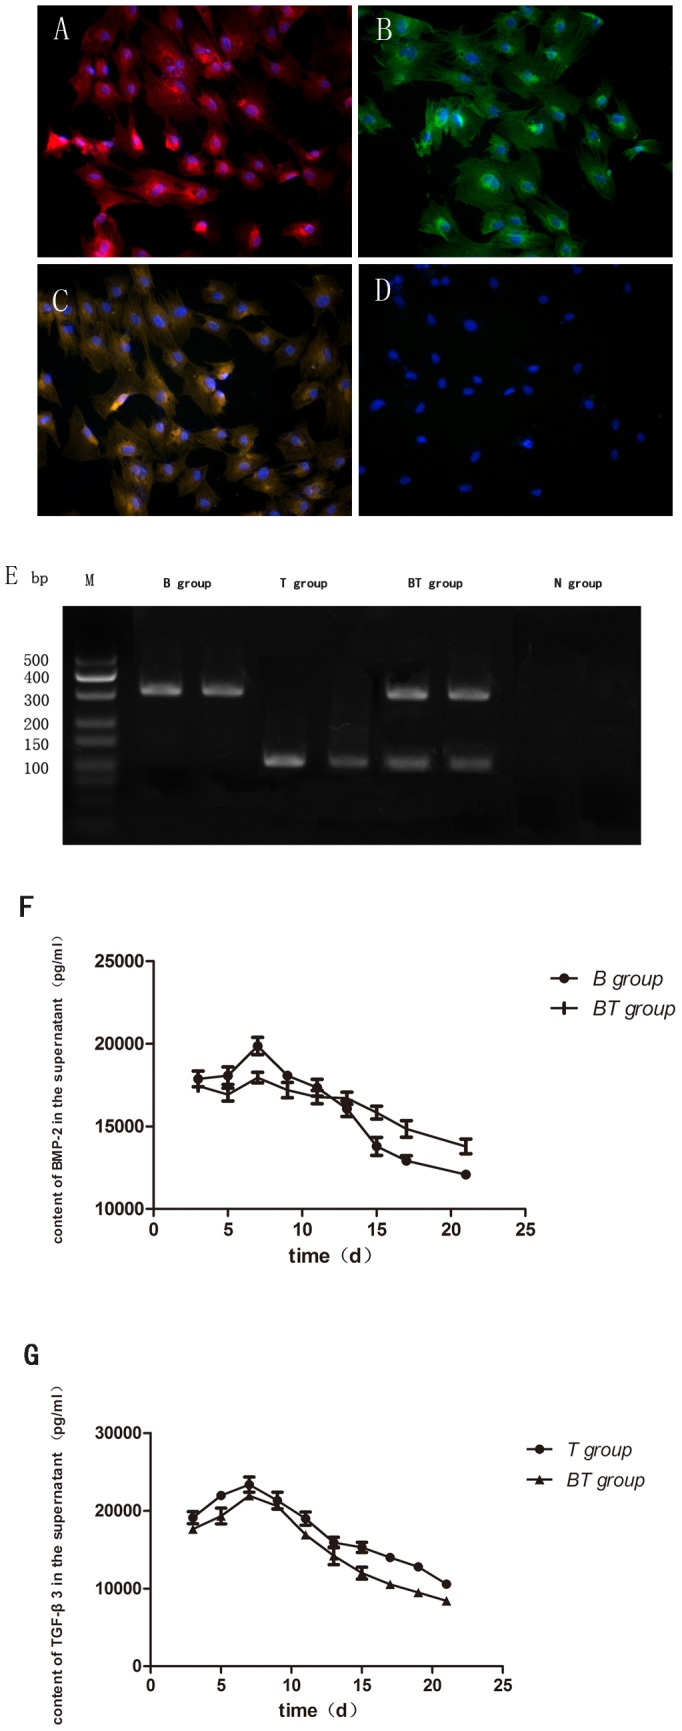
Image of immunofluorescence performed 72 hours after transfection of BMSCs. There was a positive red(A) or green(B) fluorescence staining in the BMSCs in B group or T group 72 h after transfection. Both the red and the green fluorescence were detected in the BT group (C). No positive red or green fluorescence was detected in the N group (D). PCR results showed a band at 310 bp (B group) and at 114 bp was detected in B and T group, respectively. In the BT group, both 310 bp and 114 bp bands were detected, and no band was detected in the control N group (E). ELISA assay showed that the expression of BMP-2 or TGF-β3 increased gradually and then peaked at 7 days following initial infection, and expression could still be detected till 21 days post-transfection (F,G).