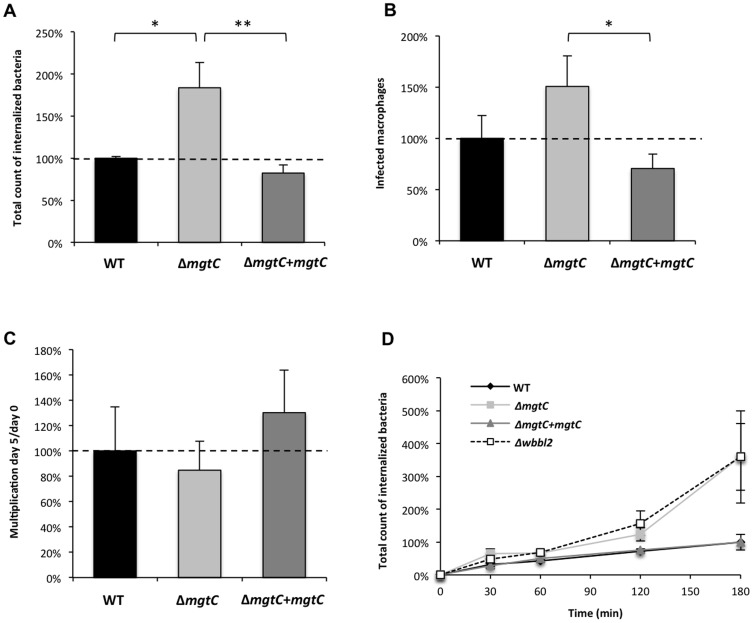
Figure 6. Phagocytosis and replication of the mgtC mutant in the J774 macrophage cell line.
(A) Phagocytosis of the mgtC mutant and complemented strains by J774 macrophages is normalized to 100% for the wild-type strain. Results are expressed as means+SD from four independent experiments. (B) Numeration of macrophages infected with mcherry-expressing bacteria, normalized to 100% for the wild-type strain. Results are expressed as means+SD from three independent experiments. (C) Replication of the mgtC mutant and complemented strains by J774 macrophages normalized to the wild-type strain. Results are expressed as means+SD from four independent experiments. (D) Kinetic of phagocytosis of the mgtC mutant and complemented strains by J774 macrophages normalized to 100% for the wild-type strain at 180 min. The wbbl2 mutant strain is used as a positive control. Results are expressed as means ± SD (error bars) from three independent experiments. Asterisks indicate statistical significance (* P<0.05; ** P<0.01).

