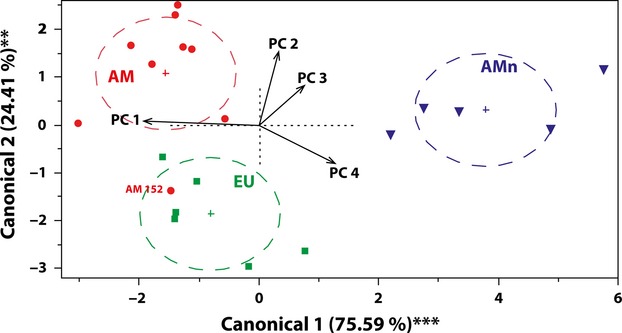
Figure 2.

Discriminant analysis of principal components (DAPC) ordination for the three groups using all significantly different variables (Tables 2 and S5). EU: native European; AM: introduced North American; AMn: native North American. The directions and lengths (×1.5) of the Principal Component axis (black arrows) represent the correlation with the first two canonical axes. The dashed circles and crosses are 95% confidence ellipses, and centroids for each group, respectively. The significance of the discriminant functions was tested by Wilks' λ test, **P < 0.01, ***P < 0.001.
