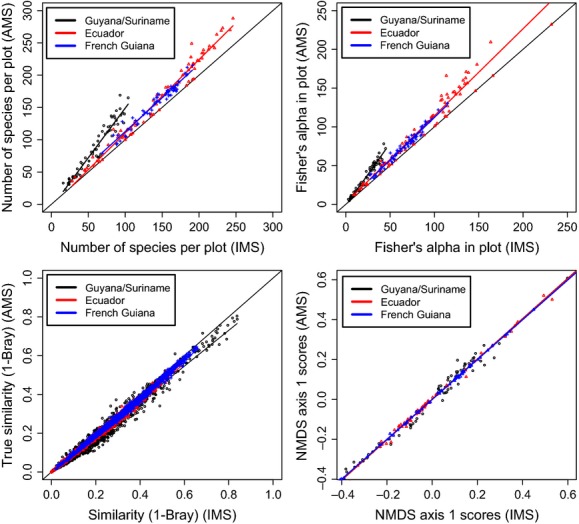
Figure 2.

Comparisons between the IMS and AMS dataset for species richness per plot (top left), Fisher's alpha (top right), pairwise similarities between all plot pair combinations (bottom left), and axis 1 scores of the nonmetric multidimensional scaling (bottom right). All analyses were performed on the three large subsets Guyana/Suriname (o), Ecuador (Δ), and French Guiana (+). All analyses show extremely similar results and yield high R2 values.
