Figure 9.

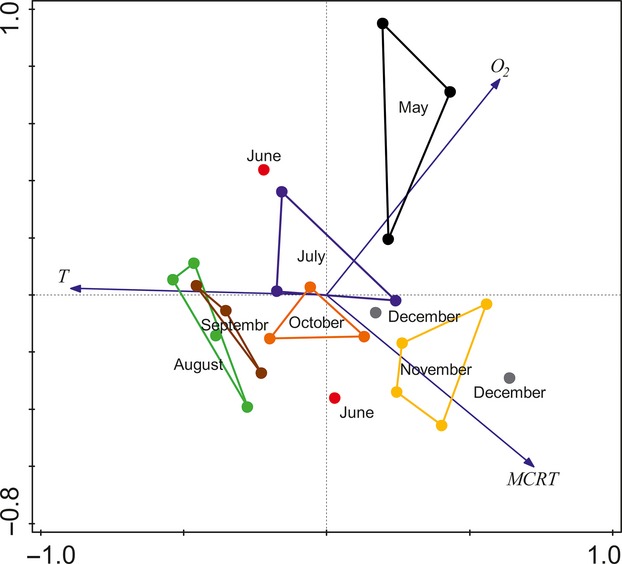
Biplot of the relationships among temperature, oxygen, and MCRT (PCA on Z-standardized values) merged with weekly means for each month from the period May–December 2012. Each point is one date of MCRT calculation within a season.

Biplot of the relationships among temperature, oxygen, and MCRT (PCA on Z-standardized values) merged with weekly means for each month from the period May–December 2012. Each point is one date of MCRT calculation within a season.