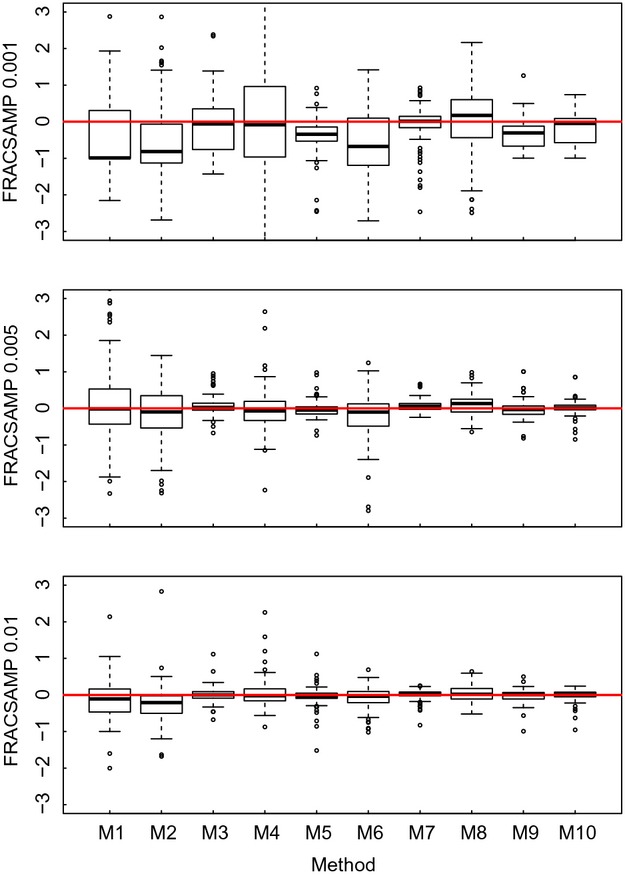
Figure 4.

The variation in the relative error of each model indicated in Table 1 for different FRACSAMP, for experiments with one replicate, for each activation energies used in simulated data (EA = 0.2–1.2 eV) for all values of TIMESAMP (5,10,15) and TEMPSAMP (3,6,11). The y axis displays percentage values of relative error. The black lines indicate the medians, and the boxes demarcate the 25–75% intervals. The whiskers extend up to one and a half times the interquartile range. The red line shows the maximum precision (i.e., estimated value = true value).
