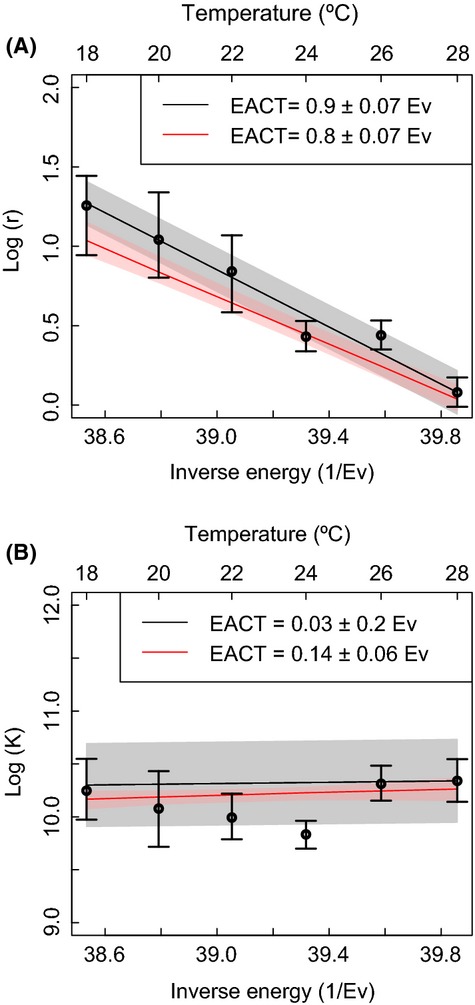
Figure 6.

Estimates of the logarithm of the growth rate (panel A) and carrying capacity (panel B) of Paramecium caudatum. The error bars show the 95% confidence interval of the estimates obtained at each temperature separately. The black continuous line and shaded area represent the estimate of activation energy and the 95% confidence interval of the estimate of activation energy obtained from a weighted linear regression from the values observed at each temperatures (methods M7 for panel A and M8 for panel B, for the methods, see Table 1). The red line and shaded area are the mean and 95% confidence interval of the estimate obtained with method M10 (as in Table 1) with two different activation energies.
