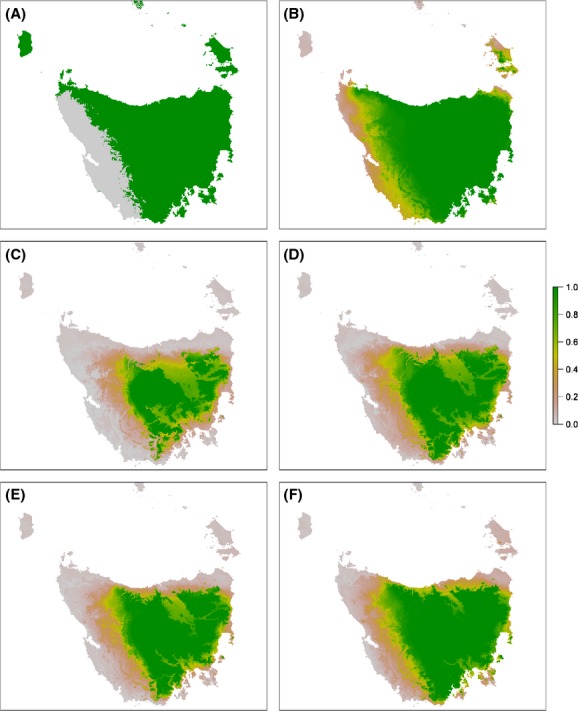
Figure 7.

Comparison of Anthochaera paradoxa models showing (A) the original model for current conditions with no simulated uncertainty, with models including all simulated sources of uncertainty combined for (B) current conditions, and projected climate in 2085 using climate models (C) CSIRO MK3.5 under the A2 scenario; (D) GFDL-CM20 under the A2 scenario; (E) CSIRO MK3.5 under the B1 scenario; and (F) GFDL-CM20 under the B1 scenario. In (A), green denotes presence and gray absence, whereas all other figures show the proportion of model runs predicting species presence.
