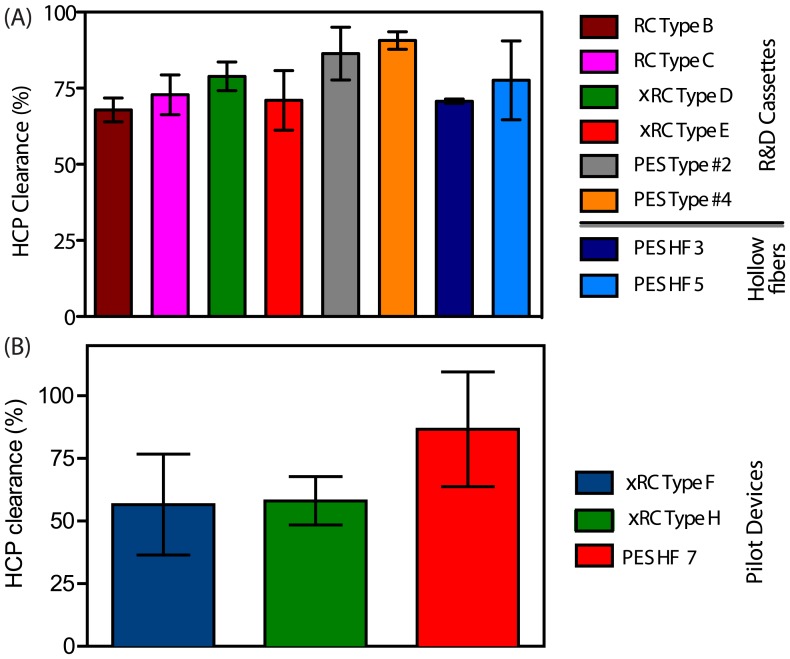
Figure 5. HCP clearance (average  SEM) as a function of the concentration/diafiltration volume for different R&D prototypes (Fig.A) and for the pilot production devices (Fig.B).
Both figure display the HCP clearance value after 10 fold concentration. The HCP clearance does not show important differences among the different cassettes and or HF. A slight increase in clearance is observed for the PES based cassettes and for the GE HF 750 kDa (PES HF 7). (For interpretation of the references to colour in this figure legend, the reader is referred to the web version of this article)

