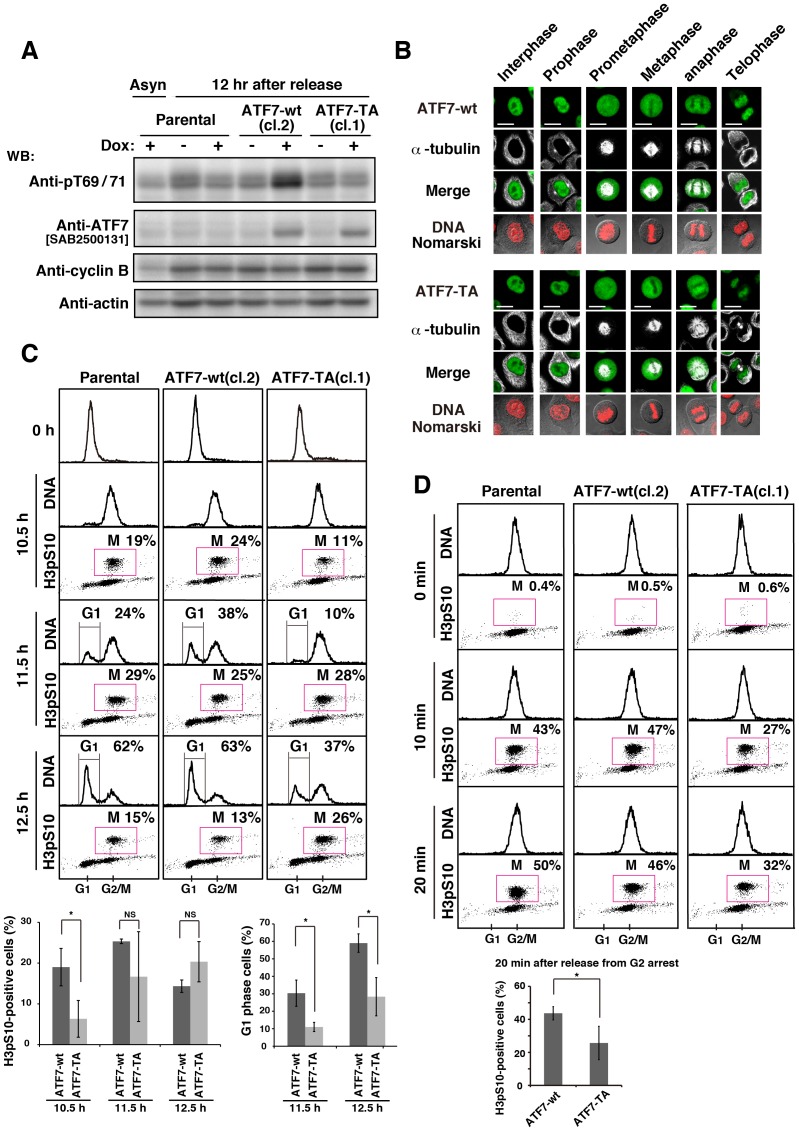
Figure 5. Role of the phosphorylation of ATF7 in G2/M progression.
(A) Parental HeLa S3/TR, HeLa S3/TR/ATF7-wt (cl.2), or HeLa S3/TR/ATF7-TA (cl.1) cells were synchronized using DTB and released into thymidine-free medium containing 1 µg/ml Dox for 12 h. Whole cell lysates were analyzed by WB. Full-length blots are presented in S12A Fig. (B) HeLa S3/TR/ATF7-wt (cl.2) (upper panels) or HeLa S3/TR/ATF7-TA (cl.1) cells (lower panels) were synchronized using single-thymidine block and released into thymidine-free medium containing 1 µg/ml Dox for 11 h. Cells were triply stained with anti-ATF7[SAB2500131] and anti-α-tubulin antibodies and PI (for DNA). Scale bars, 20 µm. (C, D) Cells were stained with anti-histone H3pS10 antibody (for M phase) and PI for analyzing cell-cycle progression by flow cytometry. (C) Parental HeLa S3/TR, HeLa S3/TR/ATF7-wt (cl.2), or HeLa S3/TR/ATF7-TA (cl.1) cells were synchronized using DTB and released into thymidine-free medium containing 1 µg/ml Dox for 10.5∼12.5 h. Two-dimensional histograms (DNA vs histone H3pS10) are presented together with DNA histograms, and the percentages of cells in G1 and M phases were measured. Cells in M and and G1 phases were quantitated from the results of S4 Fig. Values are means ± SD (three independent clones). Asterisks indicate the significant difference (*P<0.05; NS, not significant), as calculated by Student’s t-test. (D) Parental HeLa S3/TR, HeLa S3/TR/ATF7-wt (cl.2), or HeLa S3/TR/ATF7-TA (cl.1) cells were cultured in the presence of 9 µM RO-3306 for 10 h and treated with 1 µg/ml Dox for the last 5 h. The cells that were arrested at G2 phase were released into RO-3306-free medium containing 1 µg/ml Dox and incubated for 0, 10, and 20 min. Two-dimensional histograms (DNA vs histone H3pS10) are presented together with DNA histograms, and M-phase cells were quantitated. Values are means ± SD, n = 3 independent experiments. An asterisk indicates the significant difference (*P<0.05), as calculated by Student’s t-test.

