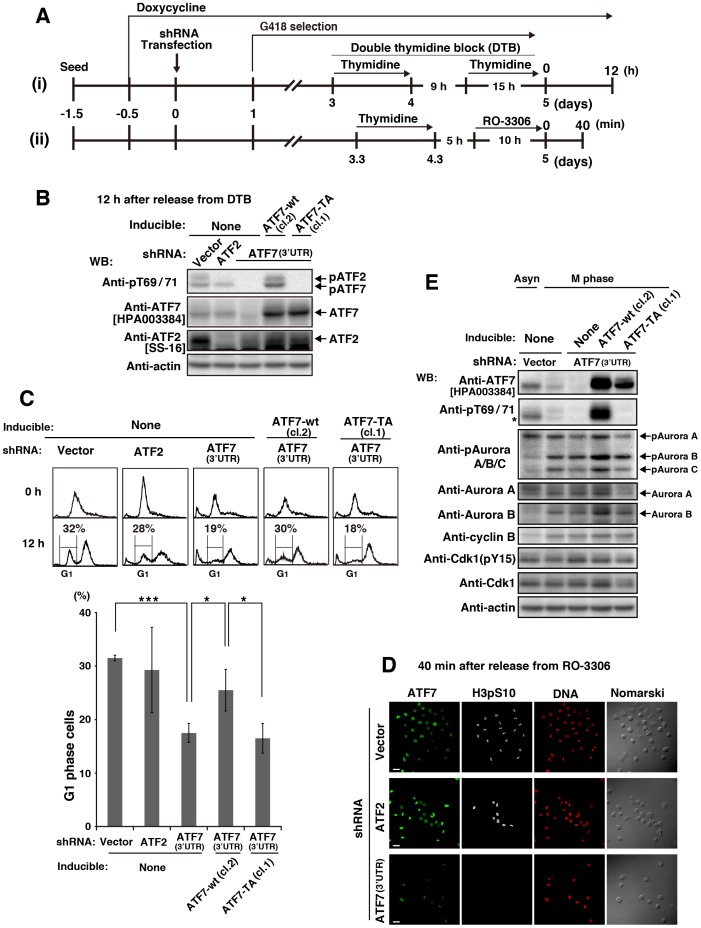
Figure 6. Involvement of ATF7 phosphorylation in Aurora signaling.
(A) Schematic depiction of our knockdown-rescue experiments. Parental HeLa S3/TR, HeLa S3/TR/ATF7-wt (cl. 2), or HeLa S3/TR/ATF7-TA (cl.1) cells were treated with 1 µg/ml Dox for 12 h and then transfected with shRNAs. Knockdown cells selected using 600 µg/ml G418 in the presence of 1 µg/ml Dox were synchronized by (i) DTB or (ii) thymidine→RO-3306. (B–D) Knockdown cells were synchronized as described in (a)-(i) and collected 12 h after release from DTB. (B) Whole cell lysates were analyzed by WB. Full-length blots are presented in S12B Fig. (C) Cells were stained with PI for analyzing cell-cycle progression by flow cytometry (panels) and for quantitating G1-phase cells (graph). Values are means ± SD, n = 4 independent experiments. Asterisks indicate the significant differences (*P<0.05; ***P<0.001), as calculated by Student’s t-test. (D, E) Knockdown cells were synchronized as described in (A)-(ii) and collected 40 min after release from RO-3306. (D) Cells were triply stained with anti-ATF7[HPA003384] and anti-histone H3pS10 antibodies (for M phase) and PI (for DNA). Cells stained with anti-histone H3pS10 antibody are pseudo-colored as white. Scale bars, 40 µm. (E) Whole cell lysates were analyzed by WB. *, a nonspecific band. Full-length blots are presented in S13 Fig.

