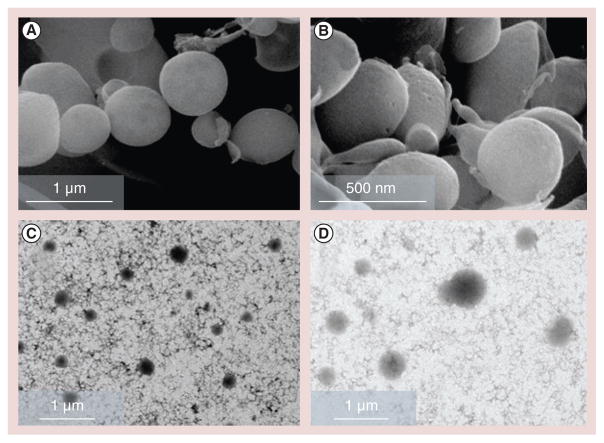
Figure 2. Morphological analysis of the nanoparticles.
Scanning electron microscopy images of (A) chitosan (CS) nanoparticles (NPs) and (B) CS–thioglycolic acid conjugate NPs, and transmission electron microscopy images of (C) CS NPs and (D) CS–thioglycolic acid conjugate NPs. All of the four images are obtained with samples prepared with a concentration of chitosan–thioglycolic acid conjugate (w/v%) of 1, a sodium tripolyphosphate/chitosan–thioglycolic acid conjugate weight ratio of 0.96 and a drug/chitosan–thioglycolic acid conjugate weight ratio of −1.

