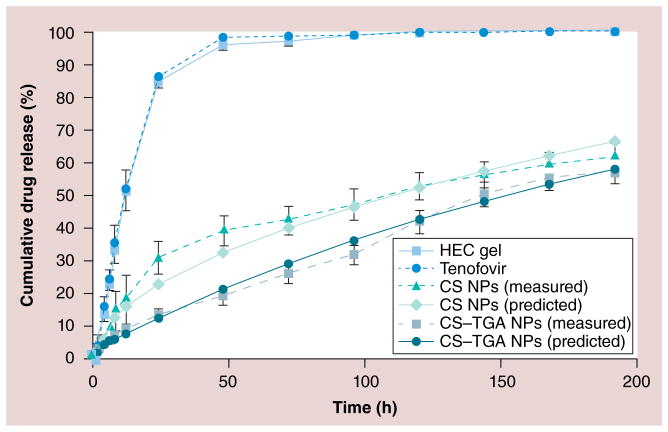
Figure 3. In vitro drug-release profiles from chitosan and chitosan–thioglycolic acid conjugate nanoparticles, in vaginal fluid stimulant (pH of 4.2; n = 3).
Both samples are prepared with a concentration of CS–TGA (w/v%) of 1, a sodium tripolyphosphate/CS–TGA weight ratio of 0.96 and a drug/CS–TGA weight ratio of −1. Data are shown as mean ± the standard error of the mean (n = 3).
CS: Chitosan; CS–TGA: Chitosan–thioglycolic acid conjugate; HEC: Hydroxyethyl cellulose; NP: Nanoparticle.

