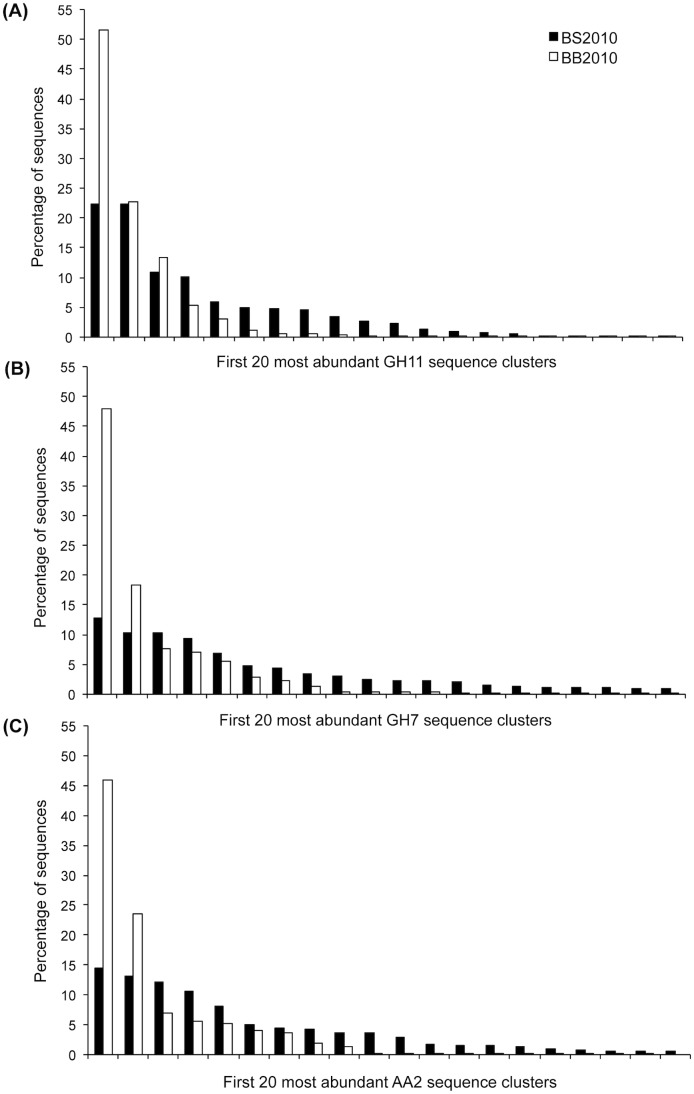
Figure 2. Distribution of the Illumina MiSeq sequences within the 20 first most abundant GH11 (A), GH7 (B) and AA2 (C) sequence clusters.
Nucleotide sequences obtained from the two studied forest soils collected in 2010 under spruce (BS2010) and beech (BB2010) were clustered at 95 (GH11 and GH7) or 93% (AA2) identity threshold.

