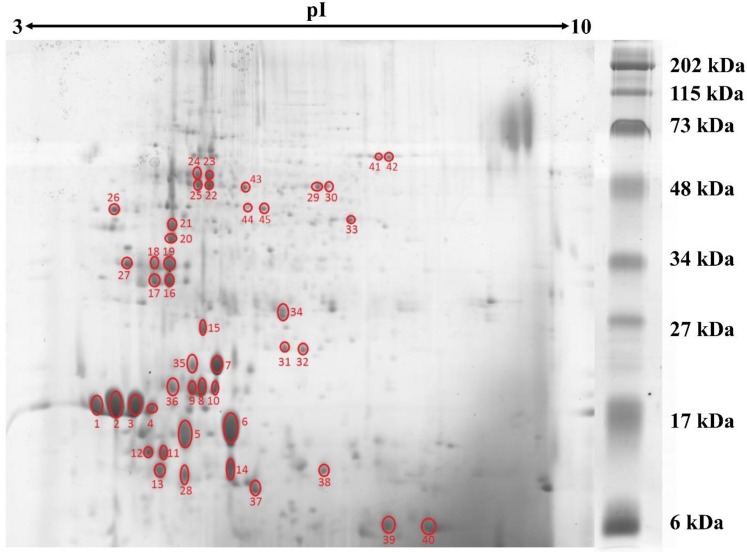
Figure 1.
2DE gel profile for the proteome of L. rhinocerotis sclerotial extract. The proteins (500 µg) were resolved by 2DE using IEF along a linear pH 3-10 gradient (13 cm) prior to 15 % SDS-polyacrylamide gel electrophoresis. Molecular weight markers are indicated on the right (30 μL/gel; Bio-Rad, California, USA). Protein spots were visualized by Coomassie Blue R-250 staining and gel image presented is representative from at least three triplicate analyses. Red circles indicate protein spots that are selected for peptide sequencing by mass spectrometry.

