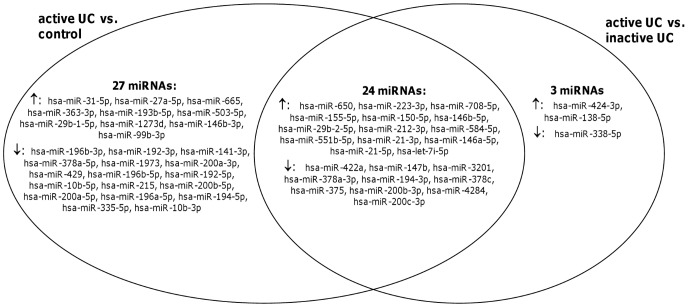
Figure 2. Venn diagram of the overlap of miRNA profiles in comparative analyses between (in)active UC and controls.
The differentially expressed miRNAs in the comparative analyses active UC vs. controls and active UC vs. inactive UC are depicted in two overlapping circles. An overlap of 24 miRNAs (14 up- and 10 downregulated) was observed between both analyses.

