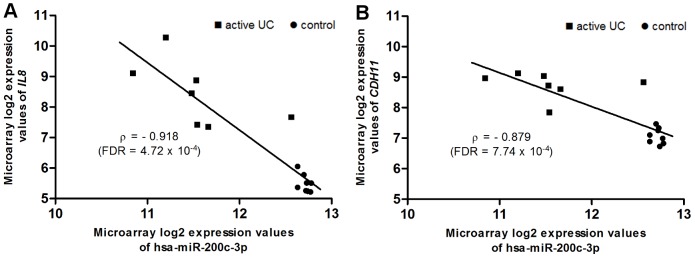
Figure 4. Scatter plot of expression levels of hsa-miR-200c-3p and its predicted target genes.

Correlation between hsa-miR-200c-3p expression values and IL8 (A) and CDH11 (B) expression values, with their respective Spearman correlation coefficient.

Correlation between hsa-miR-200c-3p expression values and IL8 (A) and CDH11 (B) expression values, with their respective Spearman correlation coefficient.