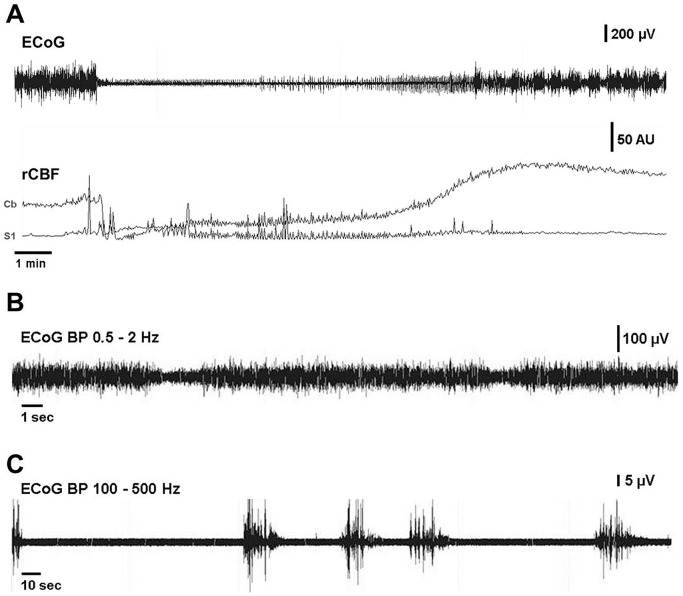
Figure 5. Exemplary ECoGs during acute SAH.
A: Induction of SAH causing immediate severe perfusion impairment corresponds to complete cessation of ECoG signal in some animals lasting several minutes with activity returning in burst suppression patterns. Interburst intervals became continuously shorter until pre-injection levels of total power were reached. B: Bandpass (0.5–2 Hz) filtered ECoG. Recurrent short episodes of depression, potentially corresponding to cortical spreading depression were recorded in the low-frequency range in SAH (n = 3) but not in either control group. C: Bandpass (100–500 Hz) filtered ECoG. In SAH animals, short bursts in the ultra-high frequency spectrum occurred about 24 hours after SAH.

