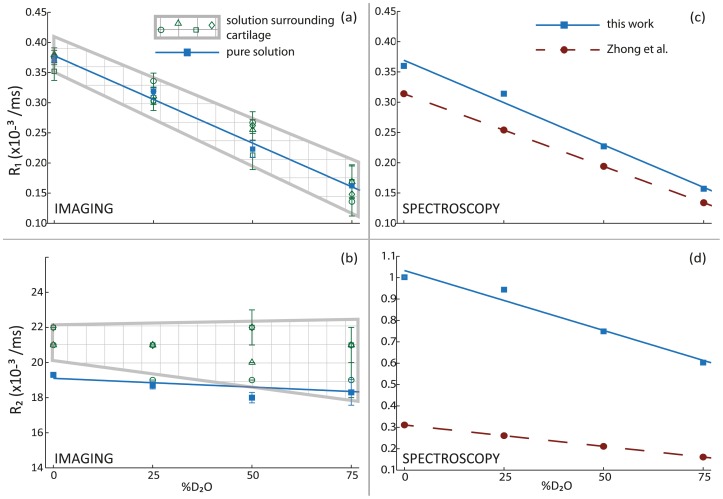
Figure 2. Effect of deuteration on proton relaxation rates in solution.
Apparent (a) R1 rates and (b) R2 rates in pure solution (blue squares; solid blue line) and in solution surrounding cartilage samples (multiple green symbols; checkered region) obtained using imaging measurements. Spectroscopic measurements of (c) R1 rates and (d) R2 rates in pure solution obtained using inversion-recovery and CPMG experiments respectively in the present study (blue squares; solid blue line) and the corresponding values obtained by Zhong et al. (red circles; broken red line).

