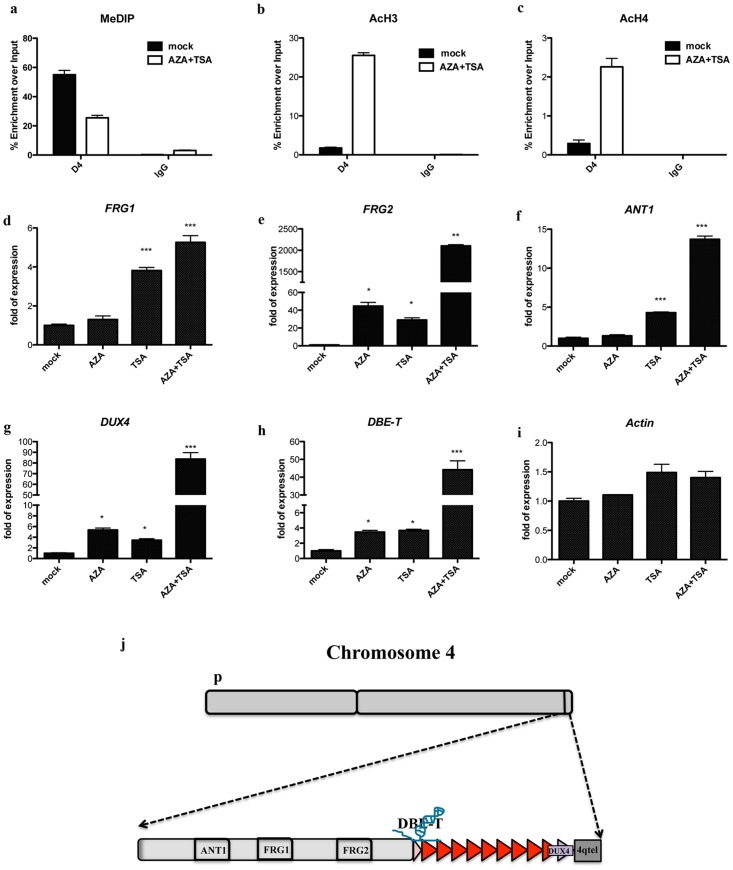
Figure 5. Effect of DNMTs and HDACs inhibitors on the expression of FSHD candidate genes.
Expression analyses for 4q35 genes upon single treatment with AZA, TSA or a combined treatment with AZA plus TSA. Relative expression of 4q35 genes, using GAPDH as normalizator and mock as reference. Graphs represent average of three independent experiments. Error bar correspond to SEM. Statistic analysis was performed using Graphpad Software. Samples were analyzed by One way ANOVA followed by Dunnett's Multiple Comparison Test. * P≤0.05; ** p≤0.01; *** p≤0.001. a. MeDIP inside D4Z4 showing reduction in DNA methylation upon AZA + TSA treatment. b. ChIP showing reduced acH3 in AZA + TSA treated cells. c. ChIP showing reduced acH4 in AZA + TSA treated cells. d. FRG1 expression. e. FRG2 expression analysis. f. ANT1 expression analysis. g. DUX4 expression analysis. h. LncRNA DBE-T expression analysis. i. Beta-Actin expression analysis, as control. j. Scheme showing location of genes of interest in the 4q35 region.

