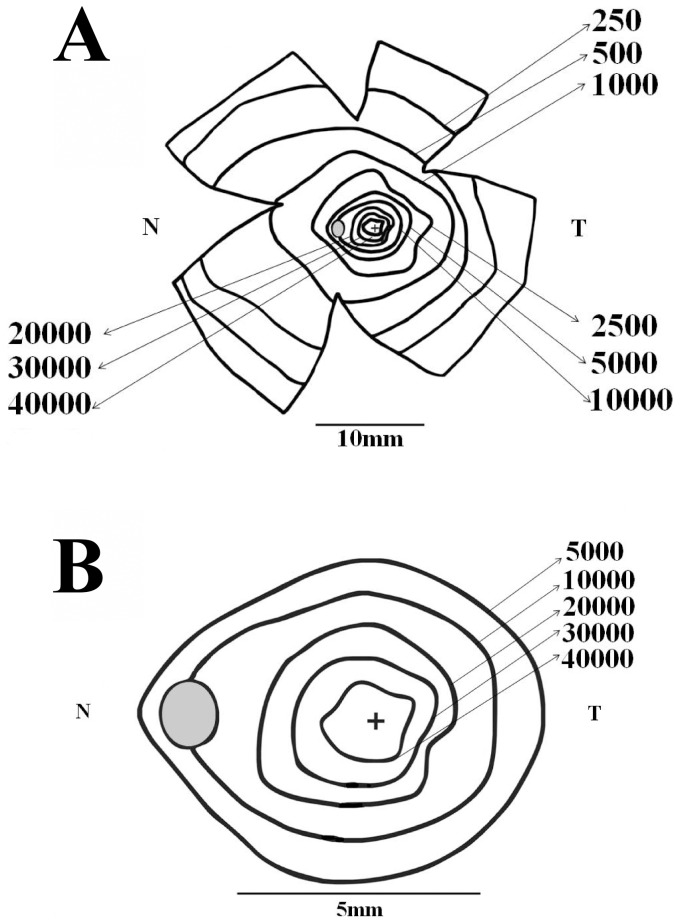
Figure 4. Ganglion cell isodensity maps for an Alouatta retina.
(A) Isodensity contours for the retina AC 01 Left Male. (B) Isodensity contours for the central region of the same retina. Isodensity contours in cells/mm2 were drawn from cell density values estimated at every retinal location that was measured and displayed as if observing from the internal retinal side. A cross and a gray oval indicate the fovea and optic disk locations. N and T indicate the nasal and temporal directions along the horizontal meridian. In this retina and all the others that were analyzed, ganglion cell isodensity contours were slightly elongated in the nasal direction.

