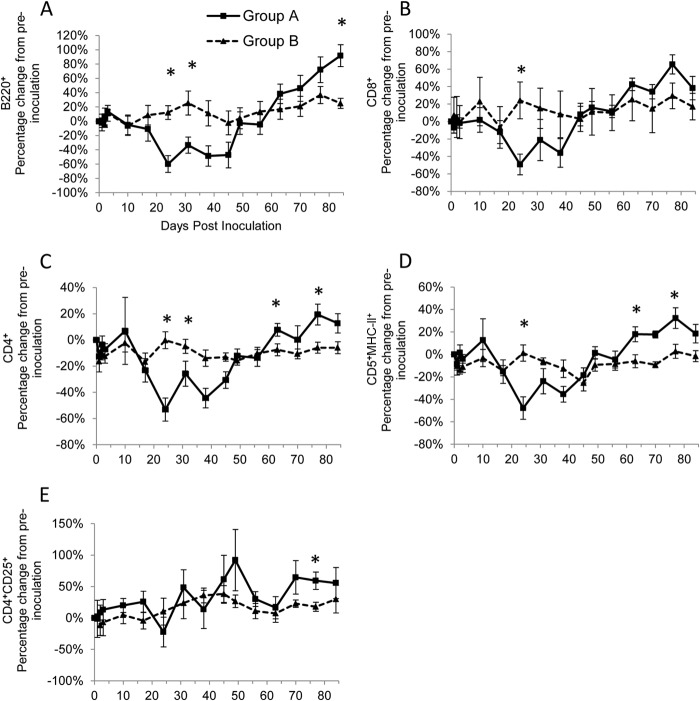
FIG 2.
Percentage of change from preinoculation with B220+ (A), CD8+(B), CD4+ (C), CD5+ MHC-II+ (D), and CD4+ CD25+ (E) cells over the course of the experiment for groups A (■) and B (▲). Each value represents the mean result for the group, and error bars represent the standard error. Time point 0 represents the preinoculation value (mean from time points −14, −7, and 0). *, statistically significant difference between the two groups at PMWU < 0.05.

