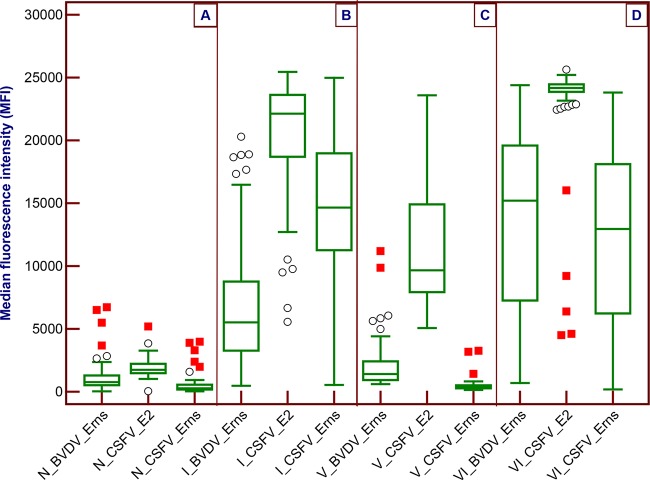
FIG 2.
DIVA potential of the multiplex microsphere immunoassay for the simultaneous detection of three antibodies in naive (A), wild-type CSFV-infected (B), CP7_E2alf-vaccinated (C), and vaccinated/infected (D) populations. The box-and-whisker plot shows the median fluorescence intensity (MFI) values from the multiplex immunoassay, with median values shown in the line within the boxes. The boundaries of the boxes indicate the 25th and 75th percentiles, and error bars above and below the boxes indicate the 10th and 90th percentiles. Outside and outlier values are represented by circles and filled squares, respectively.

