
Figure 4.
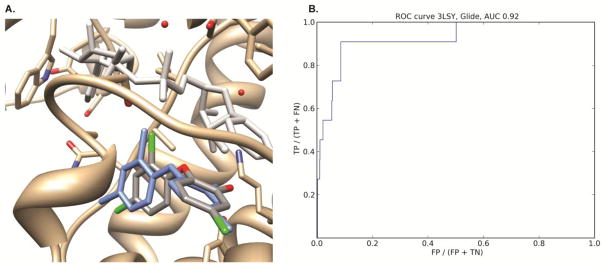
(A) AutoDock Vina docked pose of TCL into 1UH5. The ENR protein is displayed in gold, the crystallographic NAD cofactor in light grey and the crystallographic TCL inhibitor in blue. The Vina docked pose is colored according to element type. The cofactor was not present during the AutoDock Vina docking. The RMS deviation between the docked pose and the crystallographic TCL inhibitor is 0.87 Å. (B) ROC curve of docking six known actives and 1000 decoys into the 3LSY crystal structure. The area under the curve is 0.92.