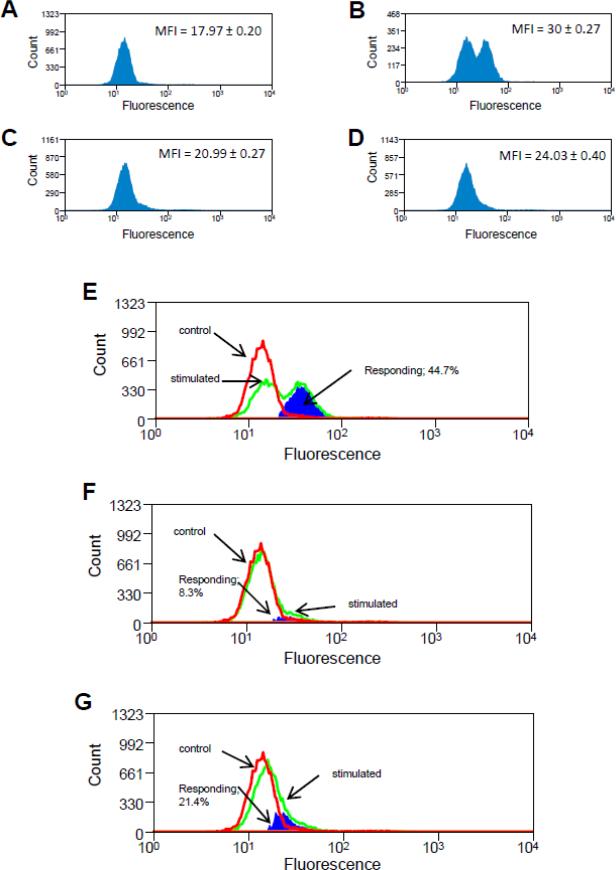
Figure 4.
Flow cytometry confirms that mercury burdened T cells which have been exposed to DHA retain the ability to activate caspase 3 in response to CD95 signaling. Jurkat T cells were treated with DHA, HgCl2, anti-CD95 or vehicle controls. Cells were then treated with a lipophillic cell permeable fluorogenic substrate possessing the DEVDGI target peptide sequence for caspase 3, and fluorescence (indicative of active caspase 3), was measured by flow cytometry and the results displayed with the histograms which are graphed. The mean fluorescence Index (MFI) of each histogram, defined as the median of the distribution is displayed to the upper right of each figure. Where indicated, subtraction of histograms was accomplished utilizing the Overton algorithm. (A) Histogram for untreated control cells; (B) Histogram for cells which have been treated only with anti-CD95; (C) Histogram for cells which were treated with Hg2+ prior to anti-CD95 stimulation; (D) Histogram for cells which were treated with Hg2+ prior to anti-CD95 stimulation, but which were also exposed to DHA. (E) Subtraction of histogram representing cells treated only with anti-CD95 (figure 4B) from control cell histogram (figure 4A) (F) Subtraction of histogram for cells which were treated with Hg2+ prior to anti-CD95 stimulation (figure 4C) from control cell histogram (figure 4A). (G) Subtraction of histogram for cells which were treated with Hg2+ prior to anti-CD95 stimulation, but which were also exposed to DHA (figure 4D) from control cell histogram (figure 4A).

