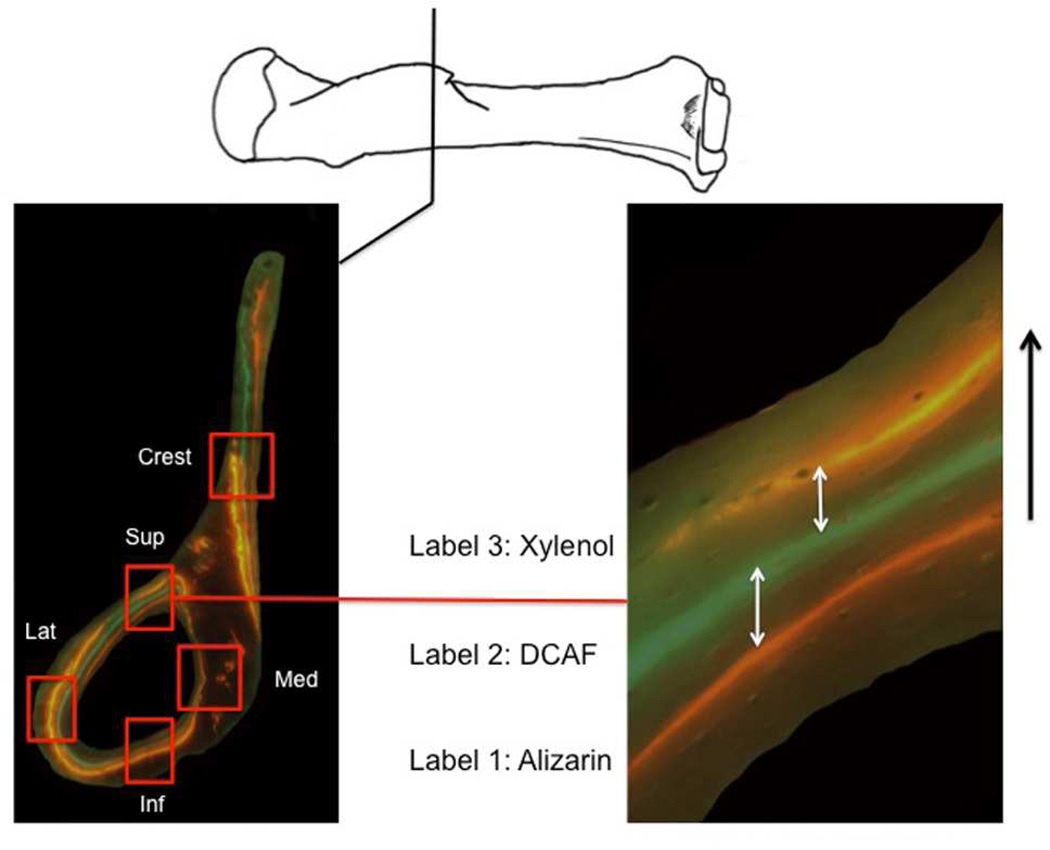
Figure 1.
Representation of the superimposed microscopy images showing the fluorescent labelling used for bone growth rate calculations. The cross-section on the left is of the distal end of the deltoid crest (climbing mouse). Each red square represents location of growth calculations (Crest = deltoid crest; Sup = superior; Med = medial; Inf = inferior; Lat = lateral quadrant). The image on the right represents the measurements taken on the cranial quadrant of the cross section (white arrows). Measurements of distances between all pairs of consecutive labels were taken. Individual measurements were then averaged across section levels to derive a mean daily growth rate calculated for each individual. Black arrow (right) indicates the direction of periosteal bone growth.

