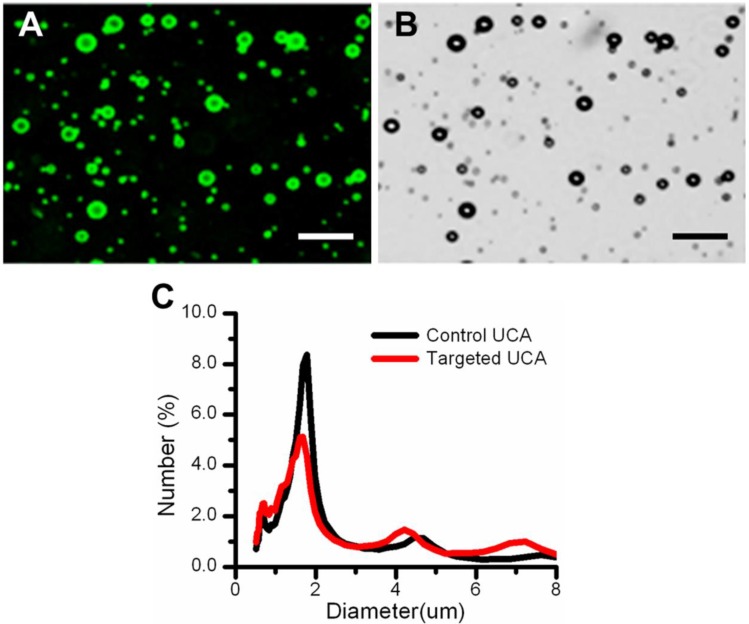
Figure 2.
Characterization of the VEGFR2-targeted ultrasound contrast agents. (A) Fluorescent micrograph of FITC-labeled VEGFR2-targeted UCA, indicating the successful conjugation of anti-VEGFR2 antibodies to the surface of UCA. (B) Corresponding transmission image of FITC-labeled VEGFR2-targeted UCA. (C) Size distribution of the targeted UCA and non-targeted UCA. A similar size distribution can be observed. (scale bar = 20 μm)

