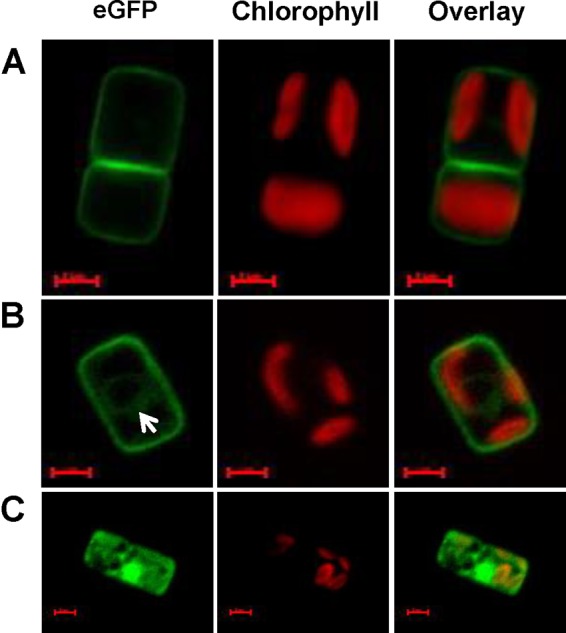
FIG 2.

High-resolution images of transgenic T. pseudonana cells expressing eGFP-tagged SIT1 (A), SIT2 (B), and SIT3 (C) under the transcriptional control of the respective native promoters in Si-starved cultures. Green, eGFP fluorescence; red, chlorophyll autofluorescence. Images were taken using a Zeiss Axio Observer.Z1 microscope with a Plan-Apochromat 63×/1.40 oil DIC M27 objective and a 38 HE filter set. Exposures times for eGFP were 307 ms (A), 300 ms (B), and 425 ms (C). The white arrow in panel B indicates the faint circular eGFP label often detected in both SIT1 and SIT2. SIT3 localization is not specific to the plasma membrane. Bars = 2 μm.
