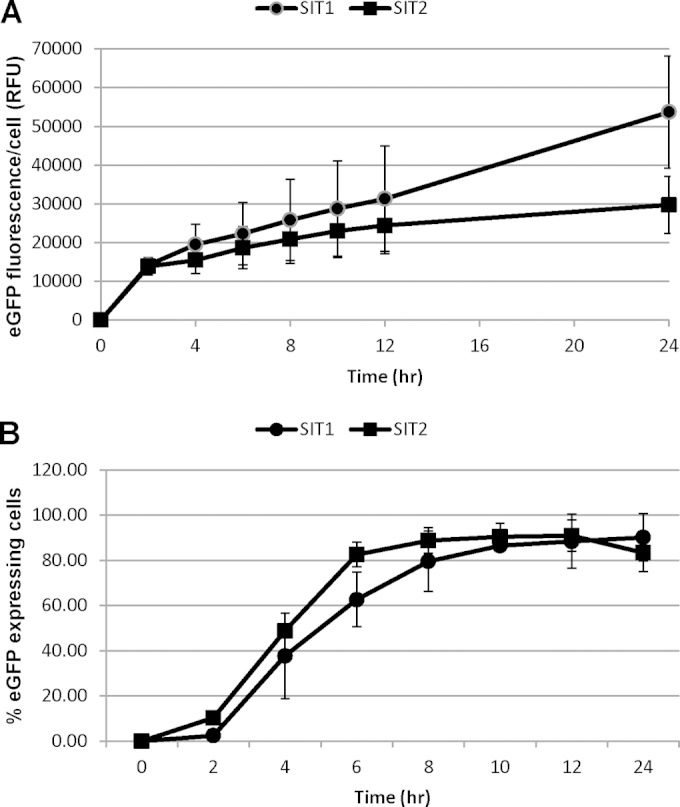
FIG 3.

Time course expression analysis of eGFP-tagged SIT1 and SIT2 under the control of the respective native promoters in Si-starved T. pseudonana cells. Exponentially grown cells were transferred to silicon-deprived medium. Expression levels were then followed by measuring eGFP fluorescence by imaging flow cytometry (488-nm laser, 100 mW) of the 20,000 cell images collected. (A) Normalized mean fluorescence intensity per cell. RFU, relative fluorescence intensity. (B) Percentage of cells expressing SITs. Bars represent standard deviations (n = 3).
