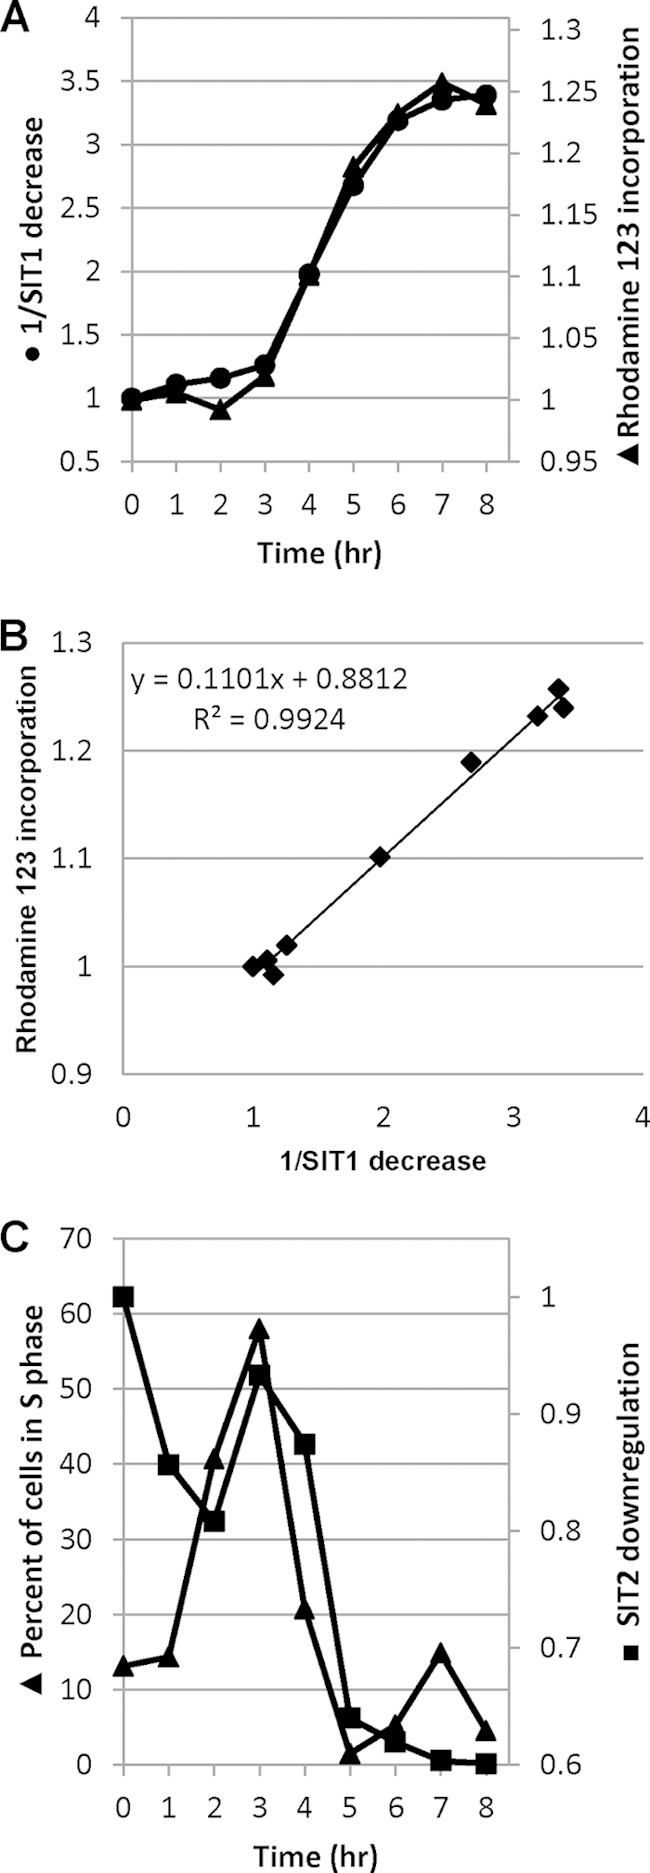
FIG 5.

Correlation between SIT expression and cellular processes. (A) Inverse of the SIT1 level (derived from the results obtained with 200 μM Si, shown in Fig. 4A) versus incorporation of a fluorescent silica tracer, rhodamine 123, as described previously (8), in the cell walls of T. pseudonana; (B) correlation between 1/SIT1 level and Si incorporation; (C) SIT2 expression level relative to percentage of cells in S phase (8).
