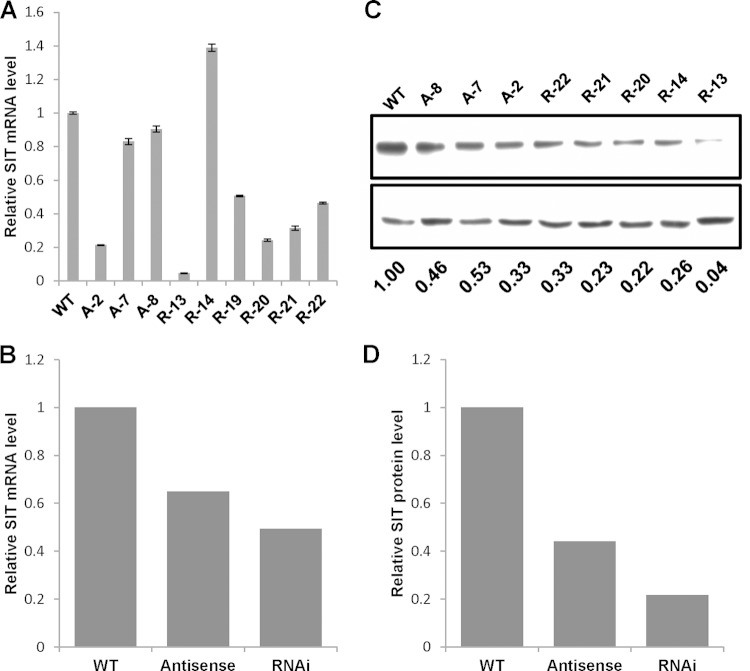
FIG 6.
RNAi and antisense RNA knockdowns of SITs. (A) Quantitative RT-PCR evaluation of the SIT mRNA level in RNAi and antisense RNA transgenic lines. TATA box binding protein mRNA was used for normalization. A and R, antisense RNA and RNAi clones, respectively. Bars represent the standard errors from quantitative RT-PCRs performed with primers specific for SIT1 and SIT2. (B) Average levels of SIT mRNA determined from the results presented in panel A. (C) (Top) Western blot of clones in which SIT was knocked down by antisense RNA and RNAi probed with anti-SIT antiserum; (bottom) Western blot of α-tubulin antibodies used to indicate the amount of protein loaded. (D) Densitometry data normalizing the SIT level to the α-tubulin level. WT, wild type.

