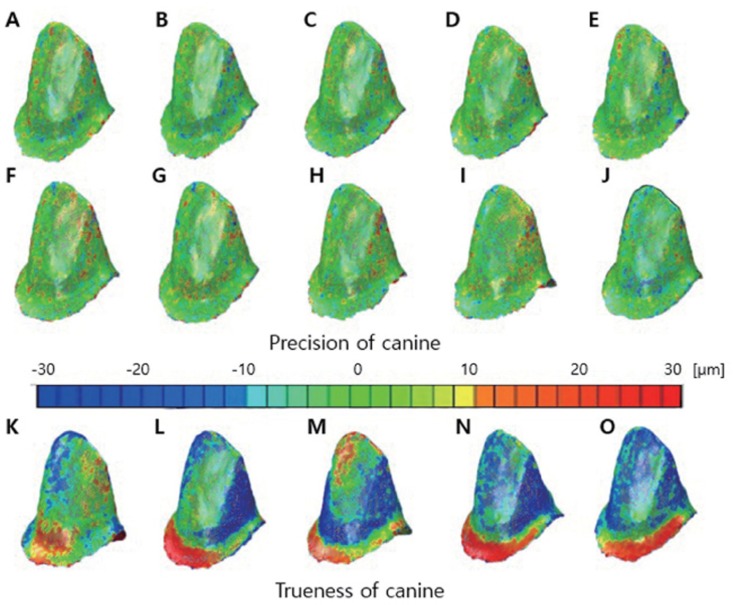
Fig. 1.
Precision evaluation for the canine: Ten color-difference maps (A-J) of scans of the canine impression showing fit alignment of digital impression data compared among each other (C_pre1 through C_pre5). Trueness evaluation for the canine: Five color-difference maps (K-O) of scans of the canine impression showing fit alignment of digital impression data compared with the reference model data (C_tru1 to C_tru5). Green represents the exact fit, yellow to red represents a positive discrepancy, and turquoise to blue represents a negative discrepancy.

