
Fig. 3.
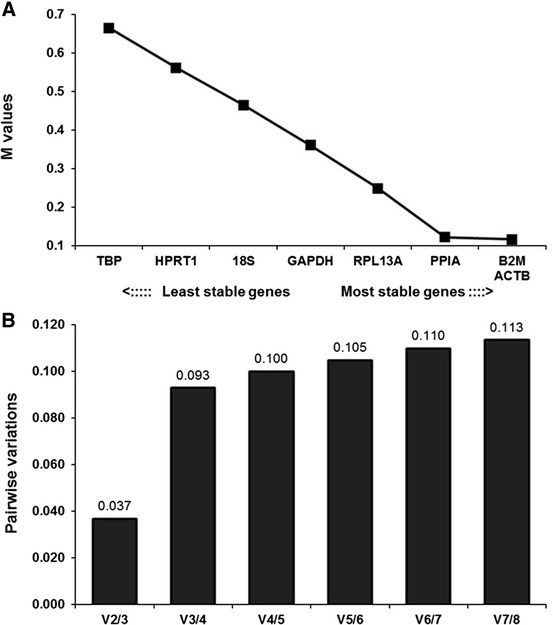
Ranking and determination of optimal number of reference genes using geNorm. a Expression stability measure (M) of the eight reference genes analyzed. Ranking of the genes according to their expression stability is indicated on the x-axis; low M values indicate high expression stability. b Optimal number of reference genes for normalization based on their V values. The V value defines the pair-wise variation between two sequential normalization factors calculated by geNorm