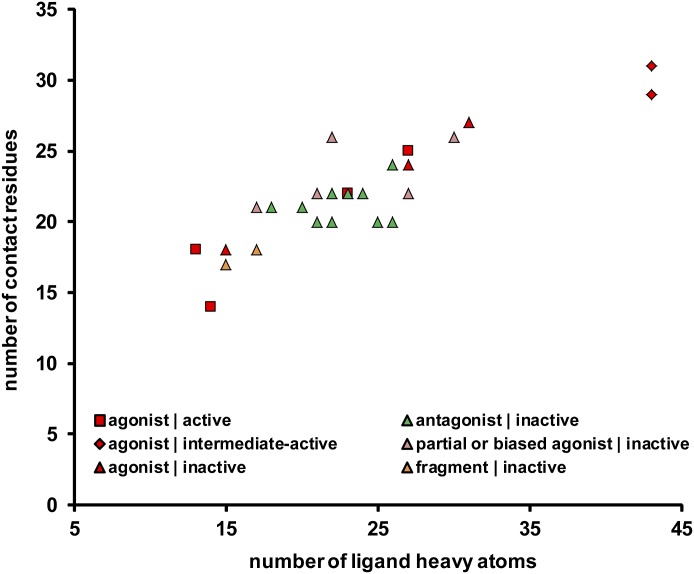
Fig. 3.
Statistics of ligand-contacting residues. The number of contact residues is plotted against ligand size for the 36 available ligand-receptor complexes. The color and shape of each point indicate the ligand efficacy and the receptor conformational state, respectively, as specified in Fig. 2. Although the number of contact residues is correlated with ligand size, the ligand efficacy is not correlated with ligand size.

