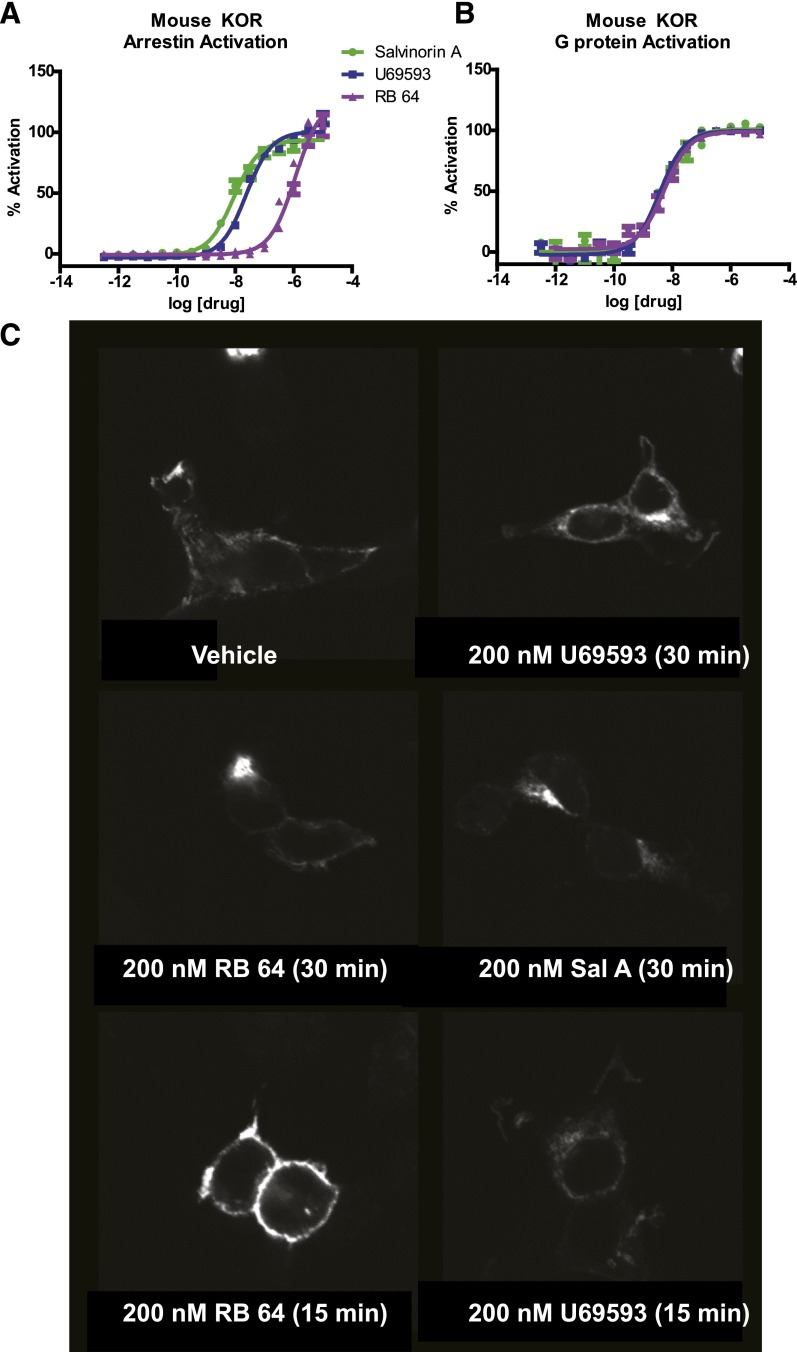
Fig. 1.
In vitro effects of agonists on signaling and internalization of the mouse KOR. Dose-response curves in HEK cells for (A) arrestin mobilization and (B) G protein signaling–induced by U69593, sal A, and RB-64. Error bars represent S.E.M. (C) Internalization of mouse KOR on stimulation with agonists (arrows indicate internalized KOR). The percent of internalization was quantified in an unbiased manner for the 15-minute study as previously described (Bhatnagar et al., 2001) as follows: control = 36 ± 9%; U69593 = 83 ± 5% (P < 0.05 versus control); salvinorin A = 82 ± 7% (P < 0.05 versus control); RB-64 = 32.7 ± 6% (NS versus control).

