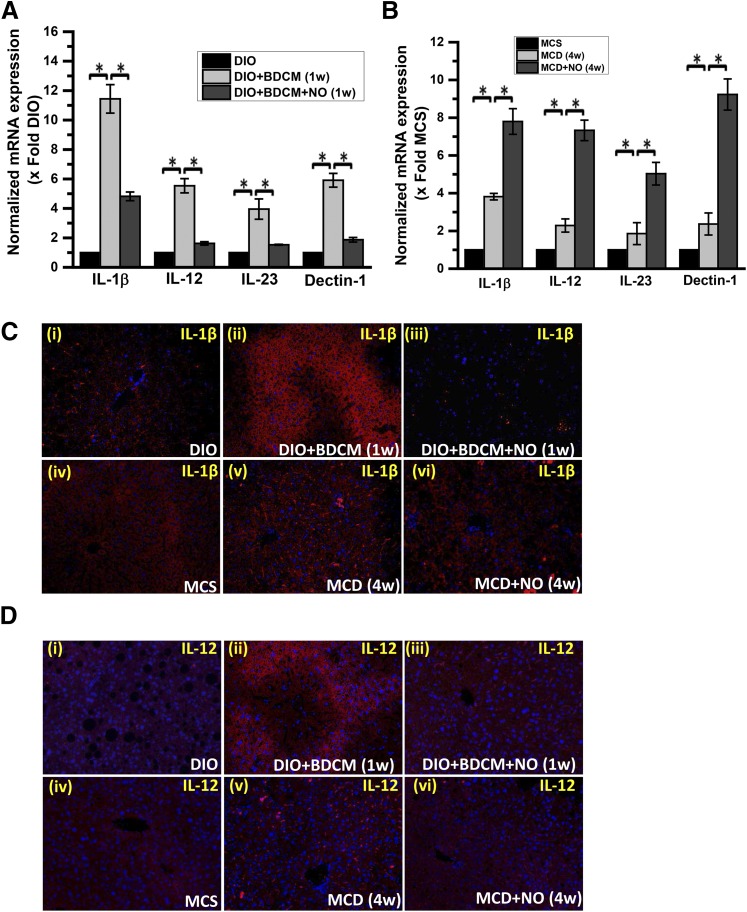
Fig. 4.
NO donor DETA NONOate attenuates the CYP2E1-mediated M1 polarization bias. (A) mRNA expression analysis by quantitative real-time polymerase chain reaction (qRT-PCR) of liver IL-1β, IL-12, IL-23, and Dectin-1 from DIO mice, DIO + BDCM (1 week) mice, and DIO mice exposed to BDCM and treated with DETA NONOate (DIO + BDCM + NO) for 1 week. The y-axis represents the fold of mRNA expression when normalized against the DIO-only group (n = 3). *P < 0.05 is considered statistically significant. (B) qRT-PCR analysis of liver IL-1β, IL-12, IL-23, and Dectin-1 mRNA expression of MCS mice, MCD mice, and MCD mice treated with DETA NONOate for 4 weeks (MCD + NO). The y-axis represents the fold of mRNA expression when normalized against MCS-only group (n = 3). *P < 0.05 is considered statistically significant. (C) Analysis of IL-1β immunoreactivity (red) by immunofluorescence imaging of paraffin-embedded liver sections, counterstained with DAPI (blue) from (i) DIO, (ii) DIO + BDCM (1 week), (iii) DIO + BDCM + NO, (iv) MCS, (v) MCD, and (vi) MCD + NO. Magnification: 20× (n = 3). (D) Immunofluorescence images of IL-12 immunoreactivity (red) of paraffin-embedded liver sections counterstained with DAPI (blue) from (i) DIO, (ii) DIO + BDCM (1 week), (iii) DIO + BDCM + NO, (iv) MCS, (v) MCD, and (vi) MCD + NO. Magnification: 20× (n = 3).

