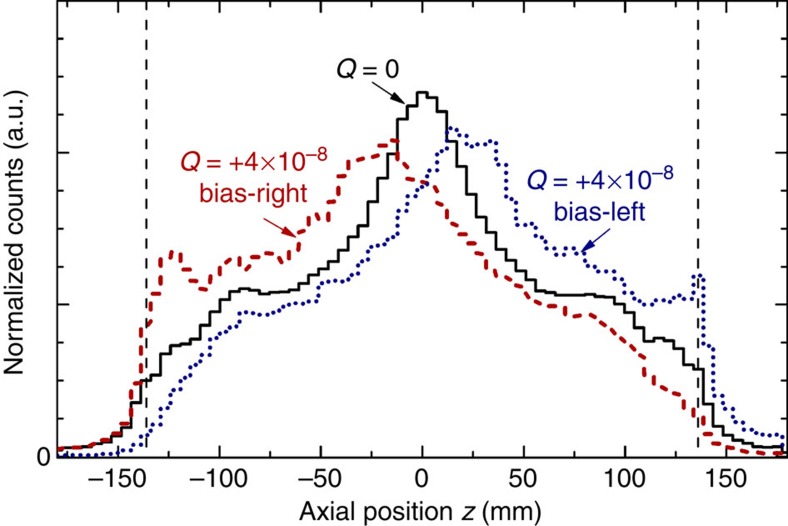
Figure 2. Simulated annihilation z-distributions.
Three simulated annihilation z-distributions, for antiatoms with Q=0 (black solid line) and Q=+4 × 10⁻⁸ under Bias-Right (red dashed line) and Bias-Left (blue dotted line) conditions. The vertical dashed lines indicate the locations of the cuts at z= ±136 mm.

