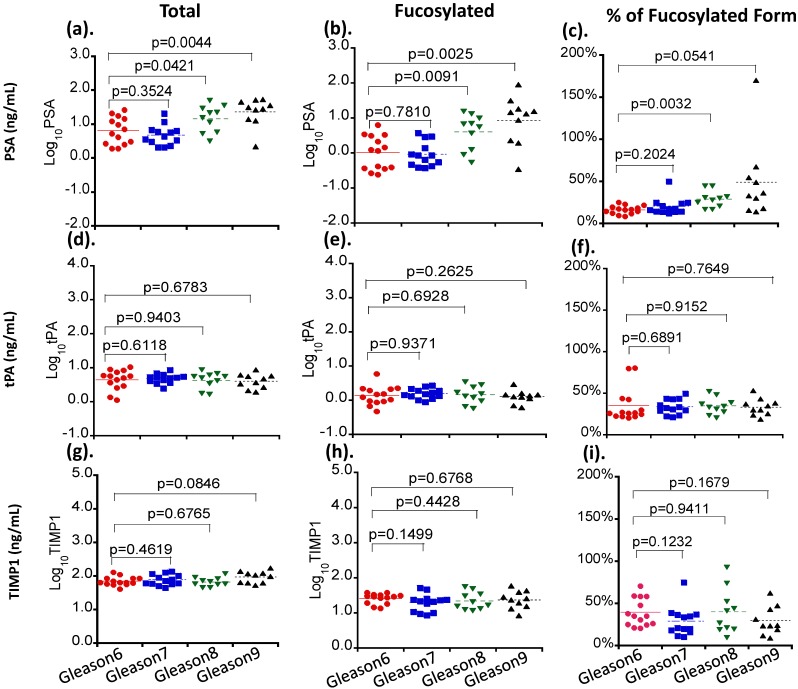
Figure 2.
The correlation of serum levels of PSA, TIMP1 and tPA with tumor Gleason scores. Different serum glycoproteins are shown in panel a, d and g. Different fucosylated glycoproteins are shown in panel b, e and h. Percentages of fucosylated glycoproteins are shown in panel c, f and i. Colored lines indicate mean values in each group.

