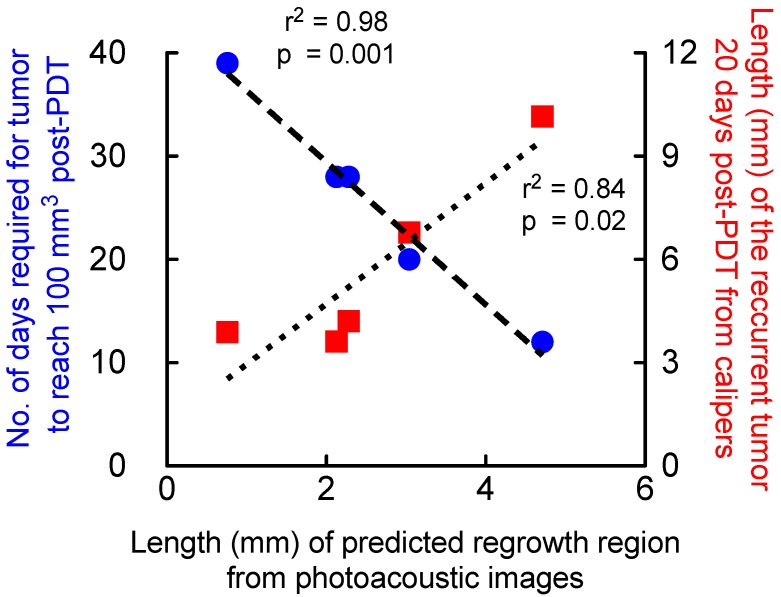
Figure 7.
The higher the diameter of prediction region, the higher the diameter of the recurrent tumor at 20 days post-PDT and lower the number of days required for the tumor to reach 100mm3 volume post-PDT. Correlation of major-axis length (mm) of regrowth region obtained from PAI prediction map in mice that underwent 1-hr DLI and had local tumor recurrence with 1. Major-axis length of recurrent tumor measured 20 days post-PDT (red squares) via calipers and 2. Number of days the tumor required to reach 100 mm3 after photodynamic therapy on Day 0 (blue circles).

