
Figure 3.
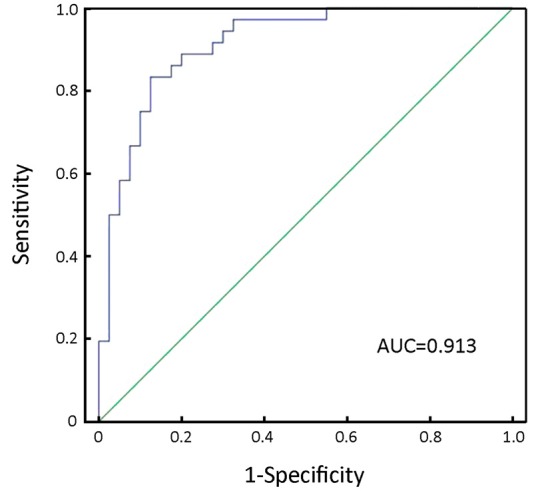
ROC curve analysis of combined miR-17 and miR-106b serum levels in GC detection. The combined serum levels of miR-17 and miR-106b yield an AUC of 0.913 with 83.3% sensitivity and 87.5% specificity in discriminating GC patients from controls. ROC, receiver-operating characteristic; GC, gastric cancer; AUC, area under the curve.