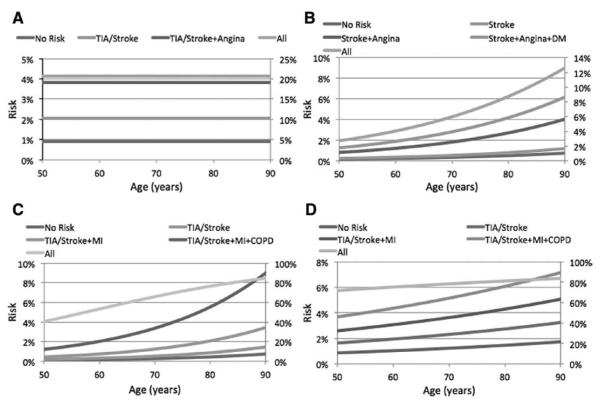
Figure 2.
Diagrams of the risk for stroke (A), myocardial infarction (Ml; B), death (C), or their combination (D) for some of the individual variables that were found to be statistically significant in the multivariate analysis, as well as the combination of some of the variables against the age of the patient. The left y axis represents the absolute probability to develop an outcome for individual risk factors or their combination. The right y axis represents the absolute probability to develop an outcome for all risk factors combined (including nonsignificant ones).

