
FIGURE 2:
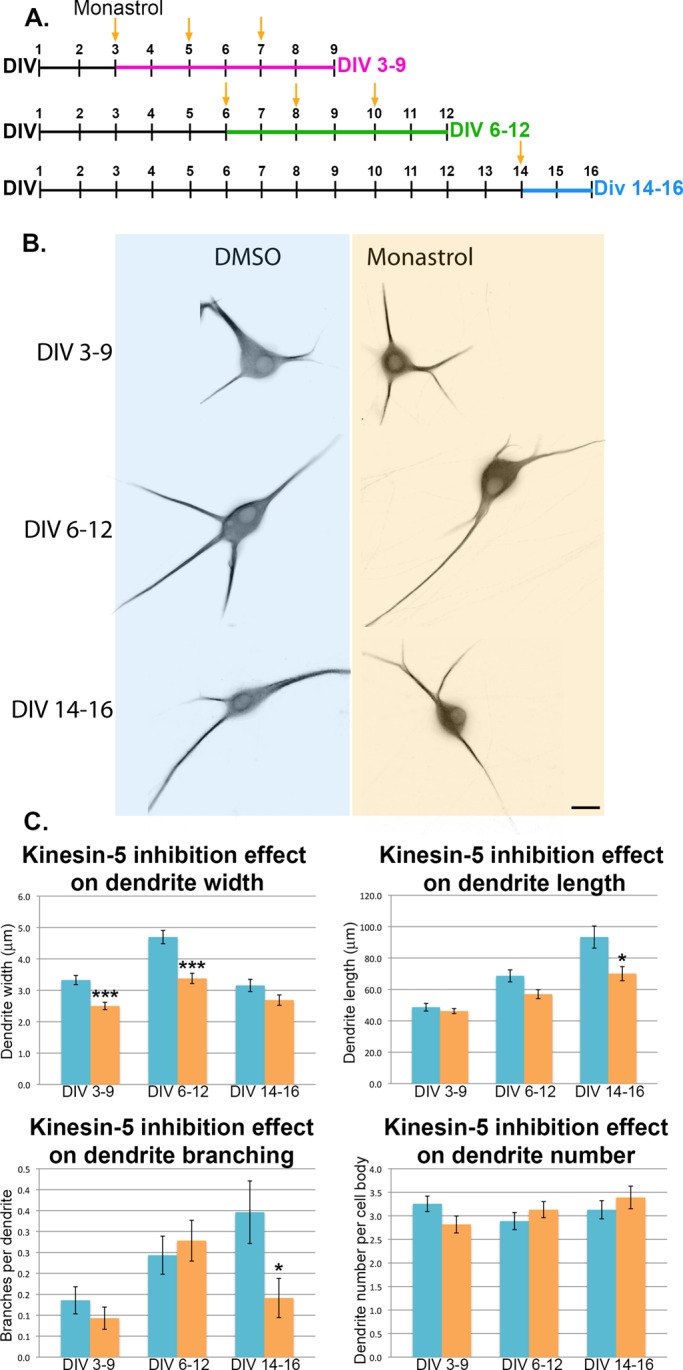
Inhibition of kinesin-5 significantly impacts dendrite morphology. (A) SCG neurons were plated on Matrigel-coated coverslips and treated with either monastrol or DMSO (as control) during dendrite development DIV 3–9, during dendrite maturation DIV 6–12, or after dendrite maturation DIV 14–16. Yellow arrows indicate monastrol (or DMSO control) application/replenishment. (B) On the last day of treatment, neurons were fixed and immunostained for MAP2 to visualize dendrites. Examples of neurons under each experimental condition are shown. Images are displayed using the “invert” function (see Materials and Methods). Scale bar: 10 μm. (C) Dendrite width, length, number, and branching were quantified. All quantifications are displayed as mean ± SEM. Width: dendrites of monastrol-treated neurons were significantly thinner in the DIV 3–9 treatment group (Mann-Whitney U-test: 3.33 ± 0.15 vs. 2.5 ± 0.11 μm, n = 140, U = 6546.5, p < 0.001) and in the DIV 6–12 treatment group (Mann-Whitney U-test: 4.70 ± 0.21 vs. 3.38 ± 0.16 μm, n = 115, U = 4333, p < 0.001), but only trending thinner dendrites were seen in the DIV 14–16 treatment group (Mann-Whitney U-test: 3.15 ± 0.20 vs. 2.69 ± 0.17 μm, n = 78, U = 2578.5, p = 0.1). Length: dendrites of monastrol-treated neurons were only trending shorter dendrites in the DIV 3–9 treatment group (48.71 ± 2.43 vs. 46.21 ± 1.56 μm, n = 140) and in the DIV 6–12 treatment group (Mann-Whitney U-test: 68.66 ± 3.82 vs. 57.02 ± 2.23 μm, n = 115, U = 5655.5, p = 0.058) and were significantly shorter in the DIV 14–16 treatment group (Mann-Whitney U-test: 93.37 ± 7.04 vs. 70.09 ± 4.49 μm, n = 78, U = 2481, p < 0.05). Branching: dendrites branched significantly less only in the monastrol-treated group DIV 14–16 (Mann-Whitney U-test: 0.35 ± 0.07 vs. 0.14 ± 0.05 branches per dendrite, n = 78, U = 2542.5, p < 0.05), with no significant difference in branching in the DIV 3–9 group (0.14 ± 0.03 vs. 0.09 ± 0.03 branches per dendrite, n = 140) or DIV 6–12 group (0.24 ± 0.05 vs. 0.28 ± 0.05 branches per dendrite, n = 115). Number: dendrite number was not significantly different in any of the groups: DIV 3–9 (3.26 ± 0.16 vs. 2.82 ± 0.18 dendrites per cell body, n = 44), DIV 6–12 (2.89 ± 0.18 vs. 3.13 ± 0.17 dendrites per cell body, n = 37), and DIV 14–16 (3.13 ± 0.19 vs. 3.39 ± 0.24 dendrites per cell body, n = 23). All blue bars on the bar graphs correspond to DMSO-treated neurons, while orange bars correspond to monastrol-treated neurons.