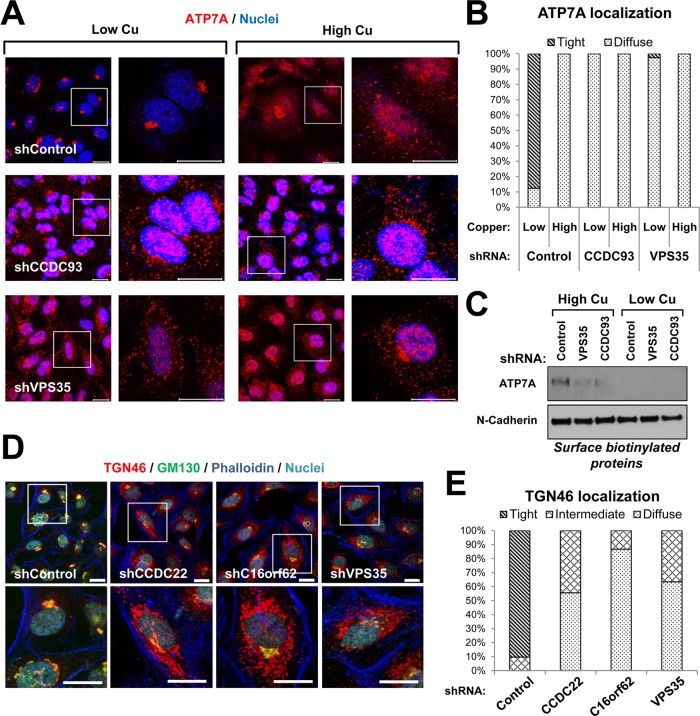
FIGURE 4:
Depletion of CCC complex components impairs trafficking of ATP7A and TGN46. (A) The indicated HeLa control and CCDC93- or VPS35-knockdown cell lines (sh, short hairpin against the indicated target) were maintained in high-copper conditions or transitioned to low copper as indicated in Materials and Methods. The cells were subsequently stained for ATP7A (red) and DNA (blue) and imaged by confocal fluorescence microscopy. Scale bar, 20 μm. (B) Quantification of ATP7A localization in the indicated knockdown cell lines was examined (>50 cells/group were scored). The ATP7A distribution observed in shCCDC93 and shVPS35 was statistically different from the control line (p < 0.001). (C) Plasma membrane expression of ATP7A was determined in the same cell lines after high- and low-copper conditions using biotinylation as described in Materials and Methods. N-Cadherin served as a loading control. (D) The indicated HeLa knockdown cell lines were stained for GM130 (green), TGN46 (red), F-actin (dark blue), and DNA (light blue) and imaged by confocal microscopy. Scale bar, 20 μm. (E) TGN46 localization was quantified in the indicated HeLa knockdown lines (>50 cells/group were scored). The TGN46 distribution observed in shCCDC22, shC16orf62, and shVPS35 was statistically different from that in the control line (p < 0.001).

